Stock Market Outlook for February 5, 2018
Immediate price resistance for today sits at the opening tick and the evening high from last night’s futures opening. That will be our watch zone across the stock market indices.
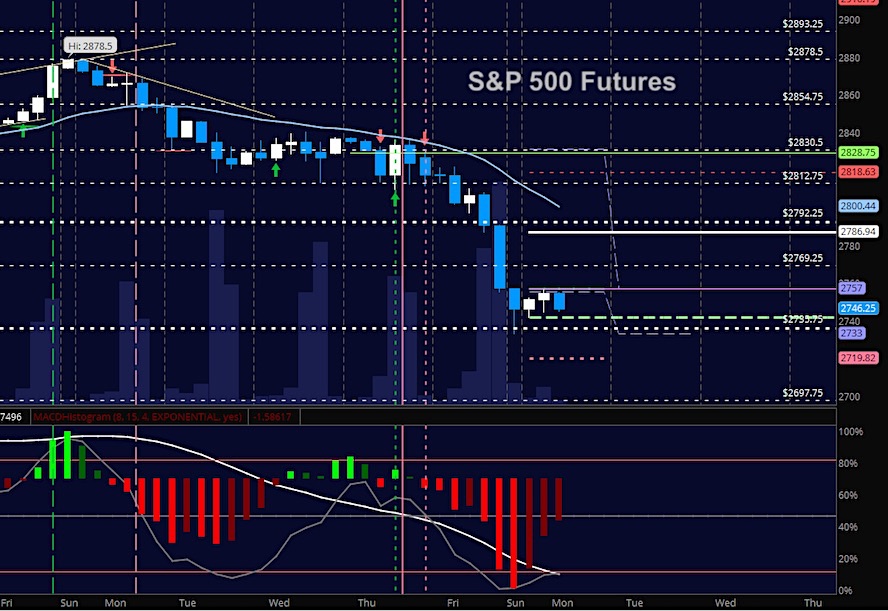
With a lower low this morning, we continue on with the short cycle that we’ve been discussing. Bulls need to recapture 2792 on S&P 500 futures in the coming days, or else sellers will remain in control of the cycle.
S&P 500 Futures
Resistance watches are now the name of the game if you are trying to pick bottoms (not a good plan right now) – if buyers can’t hold support level bounces, we’ll have yet another drift down. Momentum is steeply negative, which means there will be bottom pickers near this 2733 low. The bullets below represent the likely shift of trading momentum at the positive or failed retests at the levels noted.
- Buying pressure intraday will likely strengthen with a positive retest of 2747.75
- Selling pressure intraday will likely strengthen with a failed retest of 2734
- Resistance sits near 2742.75 to 2750.5, with 2757.25 and 2787.5 above that.
- Support sits between 2733 and 2724.5, with 2714.25 and 2697.5 below that.
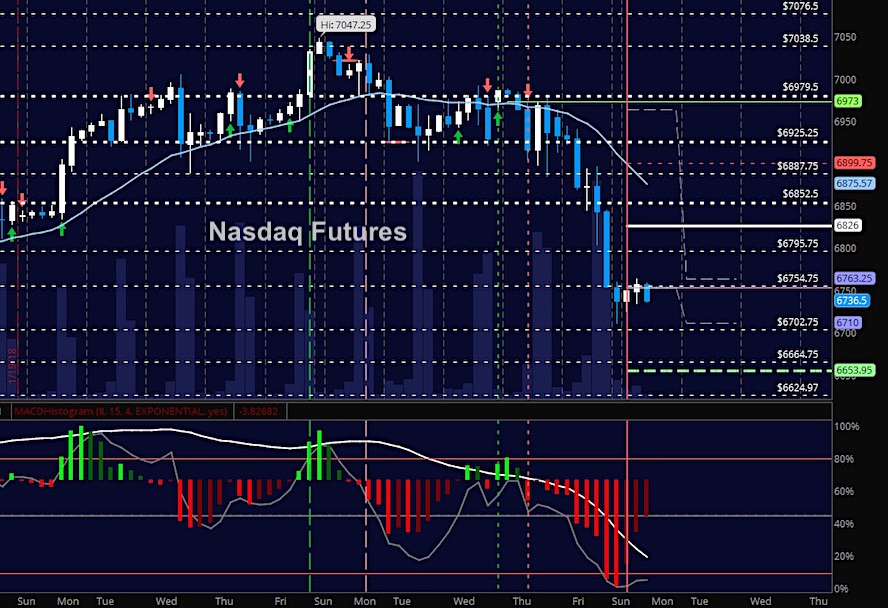
NASDAQ Futures
Momentum continues negative as traders try to bounce off the early morning lows. Buyers have to recover regions above 6826 to actually be in charge of these charts. Countertrend bounces are likely with extreme readings all around so be careful to position your trades thinking first about risk. Failure to recapture 6795 will send prices lower back to congestion near 6760. The bullets below represent the likely shift of intraday trading momentum at the positive or failed tests at the levels noted.
- Buying pressure intraday will likely strengthen with a positive retest of 6732.5
- Selling pressure intraday will likely strengthen with a failed retest of 6702
- Resistance sits near 6750.25 to 6765.25 with 6795.5 and 6826.5 above that.
- Support sits between 6702 and 6680.5, with 6664.75 and 6651.25 below that.
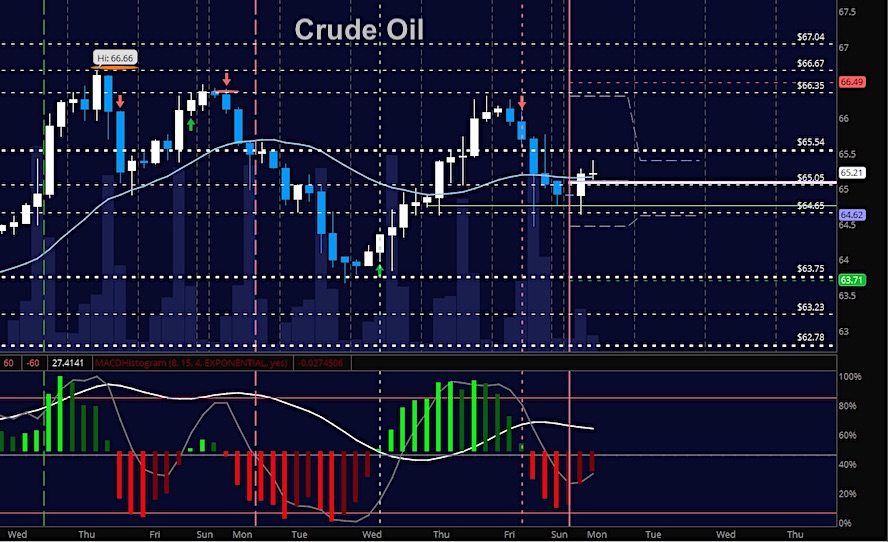
WTI Crude Oil
Traders still sit range bound in familiar zones as they hold price above 64 and below 66 in general. There is clear price acceptance in this region with 65.05 now looking like a pivot area. Trading remains choppy without resolution but momentum is drifting lower.
- Buying pressure intraday will likely strengthen with a positive retest of 65.54
- Selling pressure intraday will strengthen with a failed retest of 64.47
- Resistance sits near 65.4 to 65.54, with 66.04 and 66.44 above that.
- Support holds near 64.7 to 64.12, with 63.8 and 63.23 below that.
If you’re interested in the live trading room, it is now primarily stock market futures content, though we do track heavily traded stocks and their likely daily trajectories as well – we begin at 9am with a morning report and likely chart movements along with trade setups for the day.
As long as the trader keeps himself aware of support and resistance levels, risk can be very adequately managed to play in either direction as bottom picking remains a behavior pattern that is developing with value buyers and speculative traders.
Twitter: @AnneMarieTrades
The author trades stock market futures every day and may have a position in mentioned securities at the time of publication. Any opinions expressed herein are solely those of the author, and do not in any way represent the views or opinions of any other person or entity.


