Sometimes, the market cycle plays out in normal fashion and it appears to be doing so these days.
The U.S. added 233K net new jobs in May, a positive surprise for the month. This pushed the unemployment rate down to 3.8% (a level that matches the lowest rate reached before the 2000-2003 recession) and much better than what we reached last cycle.
The last time the unemployment rate was below 3.8% was back in the 1960’s. Add to this, the number of job openings has crept above the number of unemployed. Low unemployment rates have trickling down into wages, which are now running 2.7% higher than last year.
A classic market cycle has economic growth increasing pressure on capacity, companies in turn expand their capacity in response, unemployment falls and wages rise. The inflationary pressure from higher wages causes central banks to tighten and bond yields rise. Higher wages plus higher borrowing costs begin to put downward pressure on margins. In this scenario, even a slight slowdown in economic activity results in margins falling more, causing CFOs to cut costs by “reducing headcount’’ (aka start firing people). Next thing you know we are in a recession / bear market.
While this does appear to be playing out, we are still near the beginning of this domino scenario.
Margins remain robust at this point, and economic activity shows little sign of faltering… for now. Figuring out the turning point will be perhaps the most important asset allocation decision in the coming couple years. This article shares thoughts and things to watch for to help you make sense of the Market Cycle.
Market Cycle Remains Healthy, but has softened
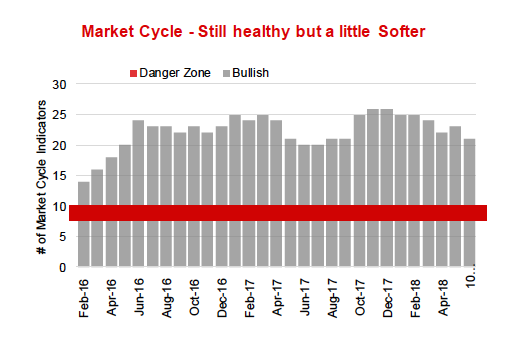
The Market Cycle chart below is our 30 Market Cycle indicators. The 30 indicators are across disciplines including interest rates, U.S. & Global economic data, momentum, valuations, company fundamentals, commodity and transportation data. Each of the 30 indicators have shown some efficacy in the past at predicting turning points in the market cycle.
Sadly there is not one model that will always work, despite everyone’s best efforts. Investing is a social science and the behavior of the participants can and do change the outcomes. Often, when too many are following a specific signal (like perhaps waiting for an inverted yield curve before becoming defensive), it often stops working. Markets change because participants change their behaviors, and this means it can never really be ‘solved’.
With the human unpredictability in mind, we use 30 signals with the full knowledge that some of the signals will work and some will not. We believe that enough of the 30 indicators will work each cycle to give us some advance notice of the bull transitioning into a bear.
Currently 21 of the 30 indicators are positive, which implies the bull should continue. Historically when the number of positive signals in the indicators drops to 10 or below there is a high probability of a bear market in the coming quarters. The current number of 21 positive indicators is still well above the Danger Zone of 10, but the recent trend has been declining. Back in late 2017, 26 were positive.
Some Strength, Some Weakness, Not a bad thing
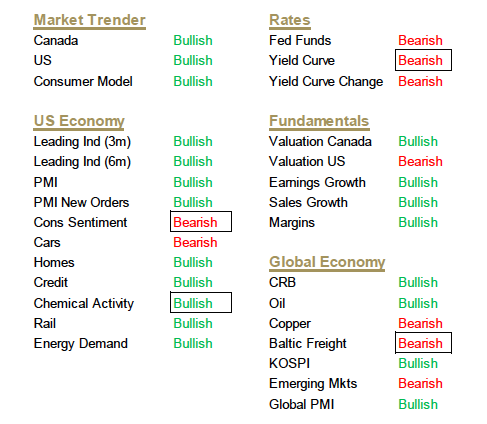
The bearish signals in our Market Cycle framework are really clustered in two areas, the global economy and rates. Rates are not too surprising as the U.S. Fed has been raising rates, the yield curve has been flattening and just recently the slope dropped below 1%. This is based on the 10-year U.S. Treasury and 3-month yields. Globally, some economic softness is evident, especially associated with emerging markets. Copper prices are declining, emerging market equities are down and the Baltic freight index is declining.
The positives are much stronger when you include the U.S. economic data, fundamentals and market momentum. Market momentum isn’t just about trend following, it has a lot to do with market confidence. For example: this week the market seems to have handled the rekindling of trade wars, without much negative results (yet anyhow). Yes, the S&P 500 did drop 0.70% when the U.S. announced new tariffs and when other countries indicated they would add tariffs too, but the market has more than recovered by the next day. This is evidence of a more resilient and confident market, able to absorb bad news.
Sometimes it is like this, sometimes it is not. Back in February, even minor bad news was having a material downward impact on the market prices. Simply put, the market is moody, and it appears to be in a good mood, for now at least.
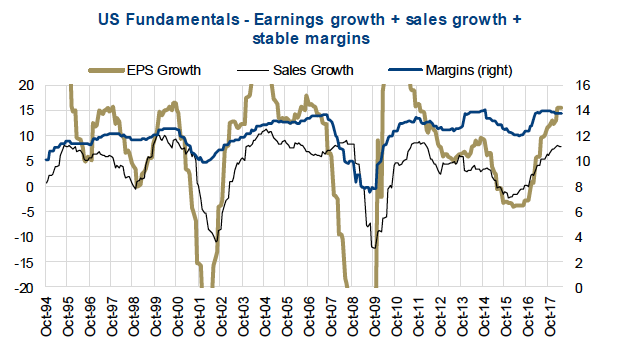
Fundamentals are good. Earnings are growing at a good pace along with sales growth. While margins are no longer expanding, they have not started to contract (see US Fundementals chart below). This strength in fundamentals is one of the factors for the market’s good mood. We are keenly focused on margins and signs of declining operating margins. However, given changes to the tax code earnings results are probably a bit skewed at the moment. Best to focus on margins and sales growth in the coming quarters.
The reason we are actually happy to see some bearish signals is we are fearful of inflation surprises. We believe the market is more sensitive to higher yields than many suspect, and inflation surprises would quickly result in higher yields. A few bearish signals in the economic data may actually reduce the likelihood of inflation surprises. Yes, we are getting close to a point in the market when bad economic data is a good thing.
Portfolio Management Implications – We remain confident the market is in the late stages of a bull market. After nine years, that is to be expected. Many of the normal late cycle characteristics appear evident including: U.S. Fed tightening, narrowing leadership, some signs of inflation and higher yields. But, at least for now, we believe the end of the cycle is not imminent. There is too much market and economic momentum which could easily carry markets to new highs. In fact we could easily see more highs and more corrections before the cycle ends in a bear market. It will likely all depend on the data, but remember, with a score of 21 out of 30, we remain in the bull camp with our eye on the door.
Charts are sourced to Bloomberg unless otherwise noted.
Twitter: @sobata416 @ConnectedWealth
Any opinions expressed herein are solely those of the authors, and do not in any way represent the views or opinions of any other person or entity.


