This post was written with Craig Basinger of Richardson GMP.
Most investors approach the asset allocation decision in what we would call the traditional approach. Determine your long term objectives, liquidity needs and risk tolerance, then select an asset allocation that has historically been a good match for reaching those goals. It is a great framework for the trade-off between risk and return. Plus, this approach is easy to implement and maintenance is relatively hands free outside of updating objectives and the occasional rebalancing.
There are some shortcomings though; one of the more obvious is it does not take into account the market environment, economy, valuations, interest rates, etc. Our proprietary Market Cycle framework is not designed to replace the traditional approach, but instead to help tweak those allocations to incorporate the current or upcoming market environment.
There are many factors that constantly impact asset prices. Some are short term, like single pieces of economic data and geopolitical shocks or changes in overall market sentiment. History and many studies show that trying to time these proves fruitless. However, other factors impacting the market are longer in nature such as the economy, aggregate fundamental company data or interest rates. Often these do not turn on a dime and can be used to get a better picture of where we are in the cycle and how we should be tilted.
The Market Cycle
The Market Cycle incorporates both the markets and the global economy, broken into five distinct phases (chart). Each phase has certain characteristics that don’t necessarily always show up but are evident more often than not.
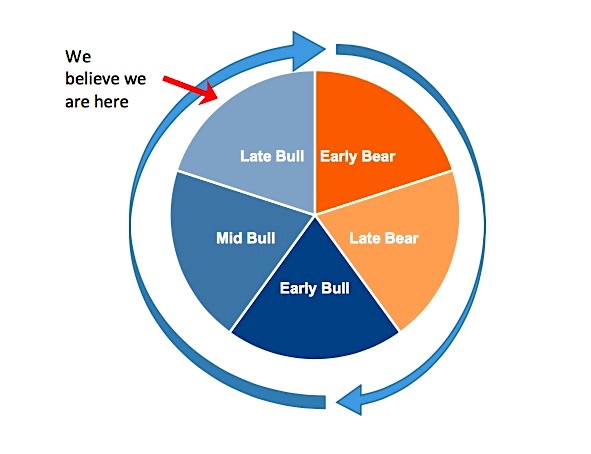
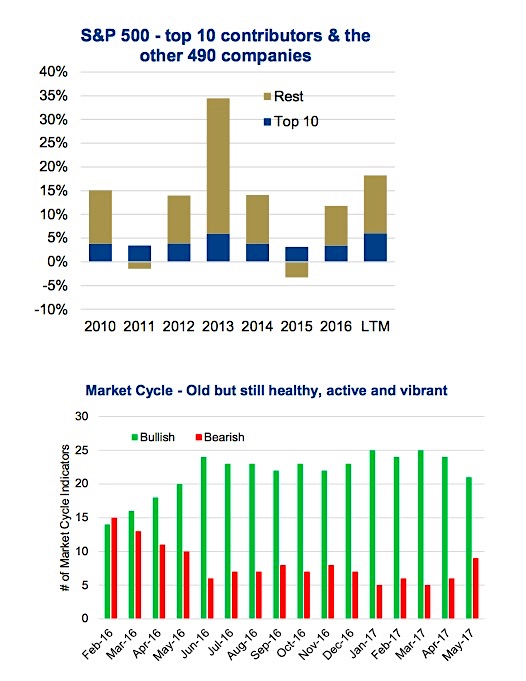
The latest bear market that coincided with a recession occurred in 2008/09. It is not simply the passage of time that has us believing we are in the Late Bull phase, there are a number of key characteristics as well. Economic data continues to improve and some inflationary pressures are starting to emerge. Monetary policy is beginning to tighten or become less accommodative. Valuations are elevated and leadership is narrowing as well. The S&P 500 (INDEXSP:.INX) is up 18% over the past year, with the top 10 contributing companies accounting for a third of the advance (6%). This includes Apple, Microsoft, Amazon.com, Bank of America, Facebook, JPMorgan, Alphabet, Nvidia, J&J and Comcast. Late in bull markets, leadership tends to narrow as the leaders have grown into more meaningful index weight and drive the index. A third of the overall index move being attributed to the top 10 is high for the S&P 500, but not alarm bell high. A 6% lift for the index from the top 10 is the biggest contribution we have seen for some time. (top chart below)
Late Bull Still Running
Given this framework and our assertion we are in the last phase before a bear begins, the question of when arises. We have found there is no single indicator that reliably signals the coming of a bear. Instead, we use a basket of signals that have proven some efficacy in warning of a change. The 30 signals range from economic, valuations, interest rates and sentiment. Currently, 21 remain bullish and 9 are bearish. This is encouraging as past bears have typically occurred when the number of bullish signals drops below 10. This bullish view is somewhat tempered by the fact that we have seen some deterioration compared to the past few months (bottom chart above).
The recent drop in bullish signals have included auto sales losing momentum, a drop in home sales and a number of commodity prices weakening. The Fed raising interest rates, flattening of the yield curve and valuations round out the bearish signals. Yet, most remain positive. This overall reading has us in the camp that the current bull is still healthy and has room to run. But given the age, we do believe a more cautionary stance to be justified.
Investment Implications
Nobody can call market tops and bottoms. While someone always happens to get the call right, doing so consistently or even getting two consecutive calls right has proven elusive. Instead, we recommend managing the turn gradually. Given the age of the market bull and some softening of our bullish indicators, we opted to become more defensive in May. In our Diversified Income portfolio (a balanced mandate), we have reduced our overweight in equity back to market weight or a more neutral stance. Plus our managed portfolios remain roughly market weight equity as well.
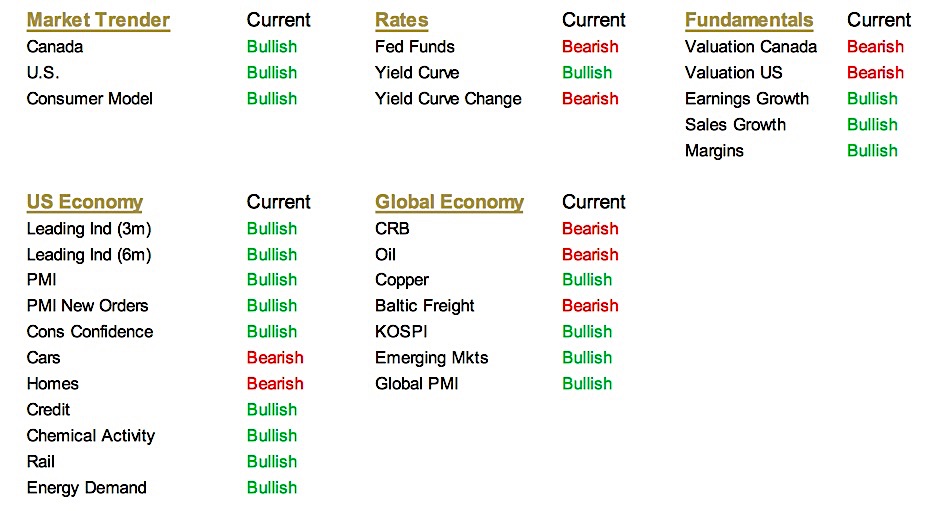
The table below includes all our signals and whether each is bullish or bearish. Thanks for reading.
Charts sourced to Bloomberg unless otherwise noted.
Twitter: @sobata416 @ConnectedWealth
Any opinions expressed herein are solely those of the authors, and do not in any way represent the views or opinions of any other person or entity.


