My macro process involves three levels: Price, Market Breadth, and Sentiment. While the S&P 500 has stalled right above the key 3600 level, market breadth in the form of the cumulative advance-decline lines suggest that there is further upside for stocks going into year end and beyond.
There are a number of ways to measure breadth, but I usually start with the cumulative advance-decline lines for the NYSE, S&P 500, S&P Mid Cap and S&P Small Cap indices. This allows me to track breadth conditions not just for the large cap space but for other cap tiers as well. Here’s the chart:
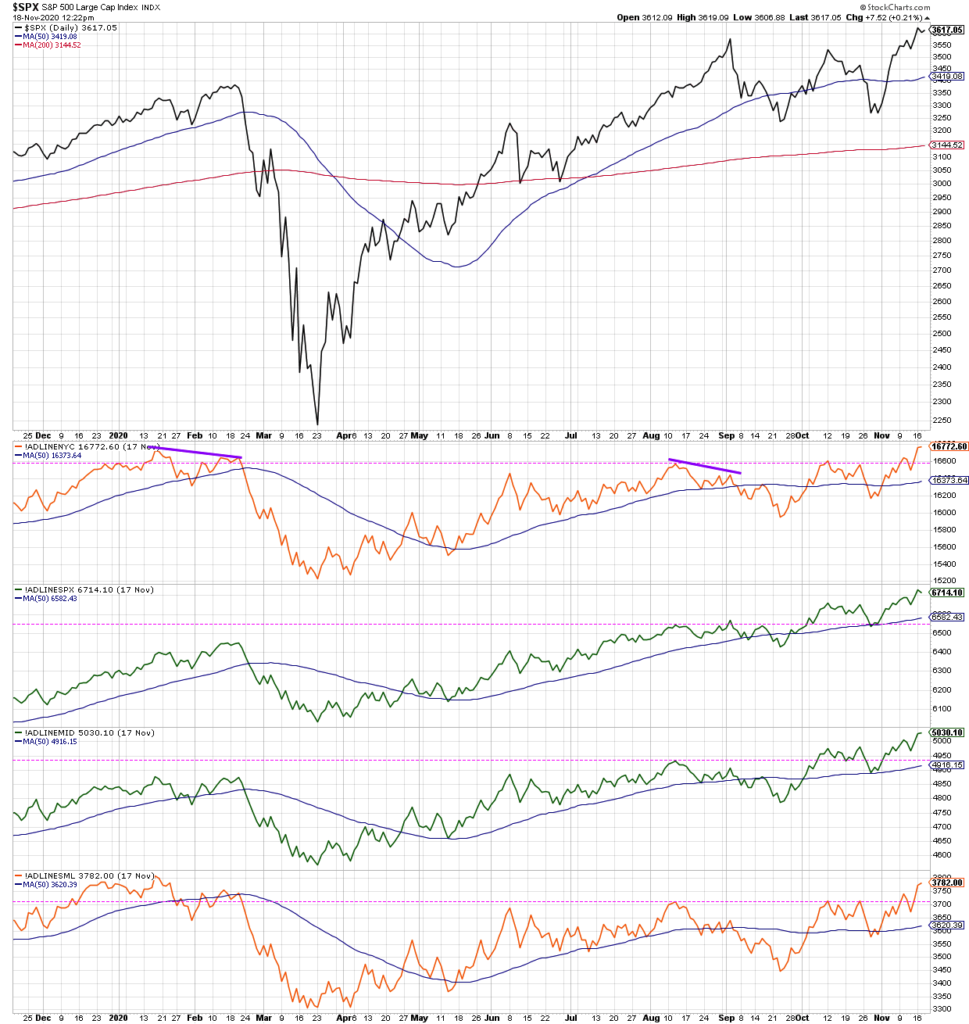
All four of these breadth lines made new swing highs in August as the S&P 500 broke above its June peak. When the S&P accelerated toward the 3600 level in early September, it’s worth noting that only the S&P 500 advance-decline line also made new highs. All of the other three established a lower high.
This is a similar pattern to January-February 2020, when the index made a new price high, but the small cap and NYSE breadth lines did not confirm the higher high. This speaks to internal weakness, especially in the small cap space.
Now fast forward to October, and you will see that we had a similar non-confirmation with the large cap and mid cap A-D lines breaking to new highs while the NYSE and small cap breadth readings remained below their August peaks. Similar to what we saw in February, this indicated that the market was rallying based on the strength of mega cap and large cap stocks but not the smaller names.
That all changed in the last week, where we now see all four breadth lines breaking to new swing highs. It’s worth noting here that the NYSE and small cap breadth lines have not yet eclipsed their January peaks so are not yet making a new 52-week high.
However, I tend to follow the trend in these lines more than anything. It’s clear to me that, for now, all of them are in a confirmed bullish trend.
Can the market pull back from these levels? Absolutely. In fact, I would argue that the extreme euphoric levels in charts like the AAII survey and Rydex flows suggest that a pullback is imminent.
But the continued strength in these advance-decline lines tell me that equities overall remain in a position of strength. And the improvement in these breadth readings show that it’s no longer just the FAANG stocks pushing higher. It’s cyclicals and value stocks and small cap names and a little of everything else.
As legendary technical analyst Paul Montgomery once said, “The most bullish thing the market can do is go up.”
To see this article in video format, check out my YouTube channel!
Twitter: @DKellerCMT
The author may have a position in mentioned securities at the time of publication. Any opinions expressed herein are solely those of the author, and do not in any way represent the views or opinions of any other person or entity.


 Ready To Break Out?")


 Rolling Over At Key Fibonacci Level?")
 Ready To Break Out?")