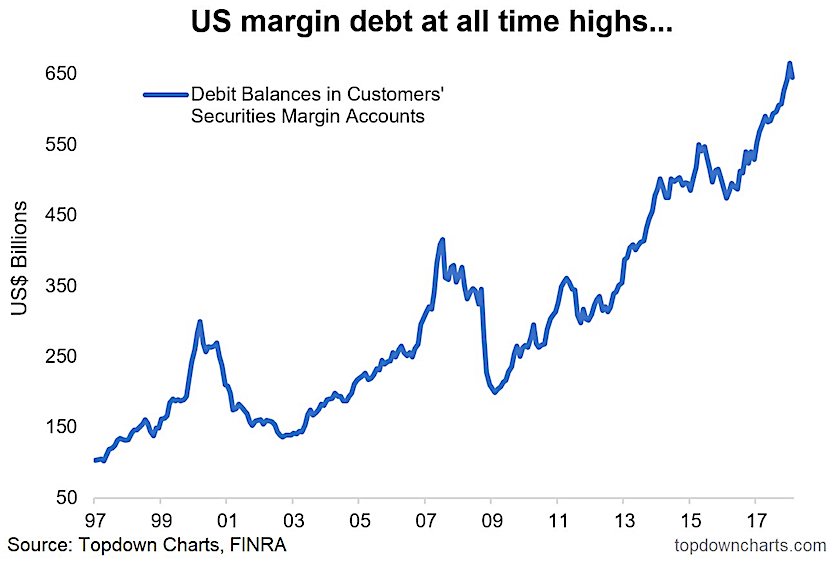
NYSE Margin debt is one of those old stock market indicators that has been around for a long time with history back to 1950, and many analysts making use of it through the ages as another data piece to understand the lay of the market land, investor leverage, and investor capacity for buying.
But something has changed!
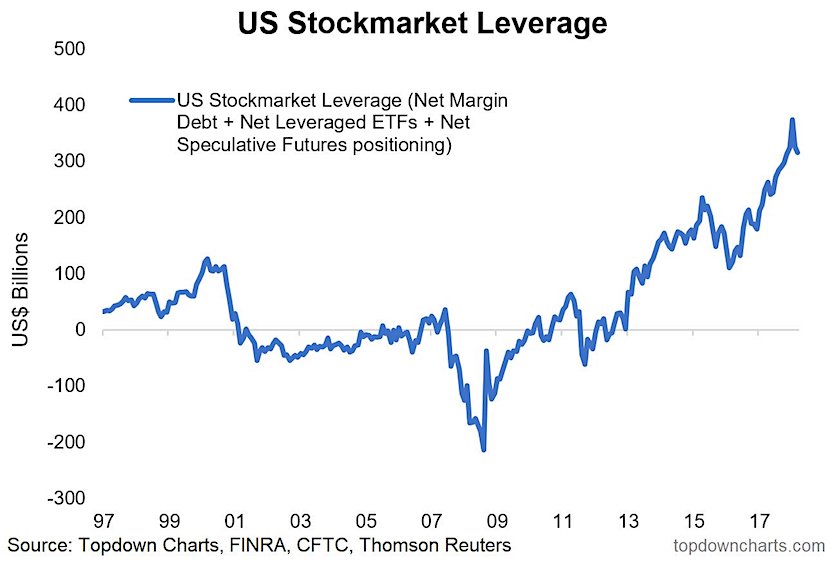
As noted below the NYSE has discontinued publishing the data, and now FINRA has stepped up to provide a consolidated and broader view of US margin debt. Taking this a step further we have added to the work of the good folk at FINRA and created a stockmarket leverage indicator. Long story short, stock market leverage reached an all time high in January and has since made a mild pull back.
My view is that the current market/business cycle is not over yet, but data like this does make me slightly nervous. When I think of the build up in stockmarket leverage I also think about how high valuations have got, how stretched sentiment had become, and how excess had been building up in places like cyclicals vs defensives.
Whether I’m right or not about the market still having some upside left, I think it’s fair to say that when the unwind does come it could get ugly.
The main takeaways from this look at margin debt and stockmarket leverage are:
– Update your sources folk, NYSE Margin Debt is no-more, it’s now FINRA margin debt (a consolidated, broader view).
– Overall margin debt hit a record high in January (slightly lower in Feb).
– Our stockmarket leverage indicator (includes margin debt, futures, and leveraged ETFs) showed stockmarket leverage climbed $400B in recent years to reach a record high in January.
1. US Margin Debt: Well first of all just a PSA for those who follow NYSE Margin Debt… that report is no more, it has ceased to be, it is an ex-datasource. In its place is the new and improved FINRA Margin Debt report which actually takes a more comprehensive view of the market, so that is a positive step. Anyway, the main point on the data is that US margin debt has pulled back slightly in February (latest data, just out, is only available up to Feb – data still gets released with a lag) vs an all time high in January.
2. US Stock Market Leverage: Taking the data a step further, this time looking at net-margin debt and also bringing in net-leveraged ETF positioning (i.e. leveraged long minus short ETF assets under management), and speculative futures positioning, we get what I call US stockmarket leverage. Now there are of course other means of obtaining leverage to bet on stocks such as options and other derivatives, not to mention the trusty old credit card or mortgage draw-down, but even just looking at this indicator it is remarkable how it went from basically zero in 2013 to almost $400 billion in January. Much like in the sentiment snapshot, it shows another view of extreme bullishness making an as yet only minor pullback.
Twitter: @Callum_Thomas
Any opinions expressed herein are solely those of the author, and do not in any way represent the views or opinions of any other person or entity.
 Rolling Over At Key Fibonacci Level?")


