NYSE margin debt dropped 2.5 percent month-over-month in December, to $461.2 billion. The S&P 500 declined 1.8 percent in the month.
Regardless if margin debt followed stocks lower or it was the other way round, what matters is that momentum is coming out of the former. And the stock market is off to a terrible start in 2016.
Margin debt peaked in April last year at $507.2 billion, and by December was down 9.1 percent from that peak.
Here are two observations regarding the margin debt peak:
First, as stated earlier, momentum is waning. If it sustains, this obviously is no good news for stocks. In all probability, margin debt will be down in January as well. Heading into Friday, the S&P 500 was down 7.4 percent for the month.
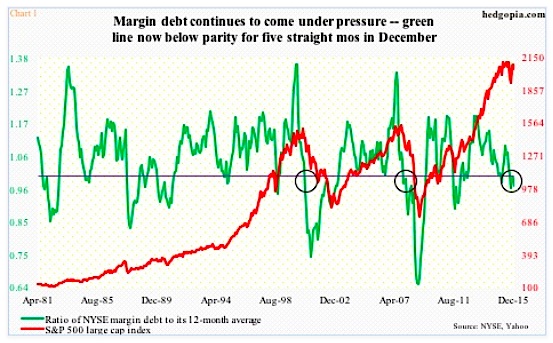
This is important, as it can be self-fulfilling, putting pressure on the green line in Chart 1. It represents a ratio of margin debt to its 12-month moving average. Once margin debt crosses below the average, it indicates waning momentum… which is already in progress. And this is likely confirming the margin debt peak last April.
Since August, the green line has been below parity. This streak likely continues in January. Historically, once the momentum sustains, stocks suffer. The most prominent crossovers took place in 2000 and 2007 (circles in the chart).
Second, for whatever reason, margin debt tends to lead banks’ commercial & industrial loans. At least in 2000 and 2008, the 12-month rolling average of margin debt peaked about a year before C&I loans (Chart 2). The correlation coefficient between the two is a near-perfect 0.96. If a margin debt peak is in place, that timing could spell trouble for Commercial loans this year.
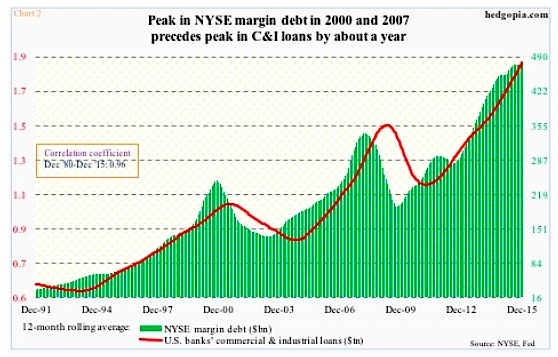
In the chart above, the 12-month average of margin debt stood at $476.5 billion, versus $476.1 billion in November. Since the April ’15 margin debt peak, margin debt has declined by $46 billion. Unless it is able to snap right back – unlikely given how 2016 has started – the 12-month average likely begins to lose momentum. And, if past is prelude, that would eventually mean C&I loans begin to come under pressure.
These loans – at a seasonally adjusted annual rate of $1.98 trillion last December – have witnessed very healthy growth. Notice the green bars in Chart 3.
Alongside this growth in loans has come growth in inventory. The chart uses inventory and sales in U.S. manufacturing and trade – $1.81 trillion and $1.31 trillion, respectively, in November.
Particularly since July 2014, the inventories-to-sales ratio has spiked. The November reading of 1.378 is the highest since June 2009.
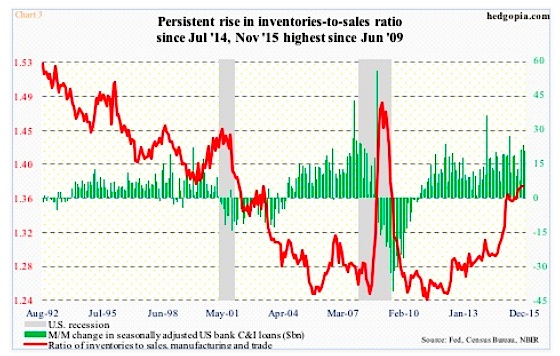
One cannot help but wonder if at least a good portion of the growth in C&I loans has gone toward inventory build. If so, as this inventory gets consumed, C&I loans should begin to lose momentum… which is what margin debt seems to be suggesting as well.
Ironically, should the green line in Chart 1 begin a rapid descent, dragging the red line along, which can then adversely impact the economy, odds grow the green bars in Chart 3 begin to shrink faster.
Thanks for reading!
Twitter: @hedgopia
Read more from Paban on his blog.
Any opinions expressed herein are solely those of the author, and do not in any way represent the views or opinions of any other person or entity.
 Rolling Over At Key Fibonacci Level?")


