By Andrew Nyquist
After peaking last summer, Corn prices began winding their way lower in what now looks like a large flag pattern. The retracement thus far has equated to roughly 50 percent of the previous run higher. But now prices are rising. So, is the March Corn flag formation bullish?
Corn prices recently found support near the 50 percent Fibonacci retracement level, 200 day moving average, and the lower trend support. The bounce has powered prices back to the descending downtrend line. A sustained break above this line would mark a breakout of the March Corn flag formation and be bullish for prices.
For more on our coverage of Corn prices click here.
Trade safe, trade disciplined.
March Corn Chart:
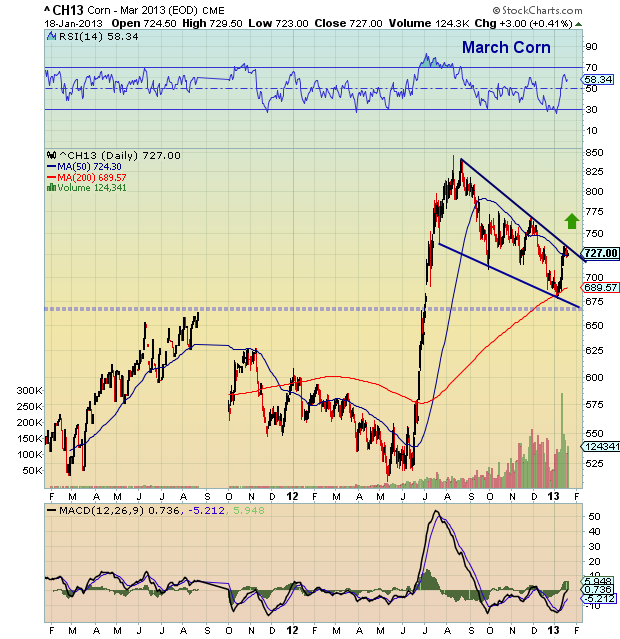
March Corn price chart with trend lines and technical analysis. A closer look at the March Corn flag pattern.
Twitter: @andrewnyquist and @seeitmarket Facebook: See It Market
No position in any of the mentioned securities at the time of publication.


