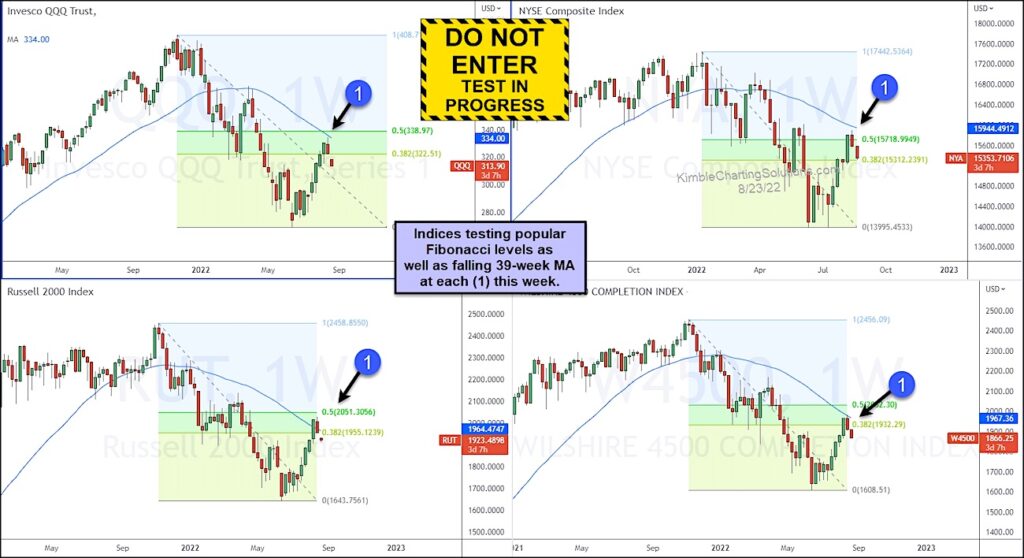
Several major U.S. stock market indices have bounced (rallied) over the past 2 months. But these moves higher are facing major test right now.
And considering that we are in a bear market… these are just bounces until more constructive rallies take place with major resistance levels breaking along the way.
Today, we share a chart 4-pack that highlights important Fibonacci resistance levels on 4 major U.S. stock market indices.
These indices include the Nasdaq 100 ETF (QQQ), NYSE Composite, Russell 2000, and Wilshire 4500. Each of them tested the 50% Fibonacci retracement level at (1) and reversed lower. Yikes!
These reversals also took place at the falling 39-week moving average for each index. Let’s just call this a “slow down” construction zone. Should these resistance levels hold firm, it could mean a pullback… or another leg lower. Careful here.
Several important tests are in play for the U.S. stock market at the same time. Stay tuned!
Nasdaq 100, NYSE Composite Index, Russell 2000, Wilshire 4500 Charts

Note that KimbleCharting is offering a 2 week Free trial to See It Market readers. Just send me an email to services@kimblechartingsolutions.com for details to get set up.
Twitter: @KimbleCharting
Any opinions expressed herein are solely those of the author, and do not in any way represent the views or opinions of any other person or entity.


