After a huge down move that began in December 2021, the long-dated treasury bonds ETF (TLT) has had a few shallow short-covering rallies, but not much more than that.
The “higher-for-longer” for interest rates narrative, coupled with higher inflation and the strong labor market are 3 big reasons the FED is on hold. Nonetheless, this week the long-dated treasury bond rally has our attention.
Some reasons for this treasury bonds rally:
- Long-term bonds (those with longer maturities) are more sensitive to changes in interest rates than short-term bonds.
- When long-term bond prices rise, it means that their yields (interest rates) are falling.
- Lower interest rates make existing bonds more attractive because they offer relatively higher yields compared to newly issued bonds with lower rates.
As rates go down, the value of long bonds rallies or increases.
With many of the more recent statistics pointing towards an economic contraction or perhaps worse- oncoming stagflation or even worse-a looming recession, we must look at the 20+ Year treasury bonds ETF (TLT) and understand the reasons bond yields could be falling right now.
Monetary Policy: June FED meeting-When the Fed signals a shift toward lower interest rates, bond prices tend to rise-are they getting ready to do a June cut?
Economic Conditions: A moderating economy, dovish central bank discourse, and forecasts for milder GDP growth can all contribute to bond rallies. At the end of this week, we will see the updated non farms payroll number-is unemployment increasing?
Inflation Expectations: If inflation remains subdued, bond markets anticipate progress, leading to rallies-PCE last week came in with some areas of inflation subdued.
Supply and Demand: When demand for bonds exceeds supply (more buyers than sellers), bond prices rally. China has been selling US bonds-are they done?
Technical Indicators:
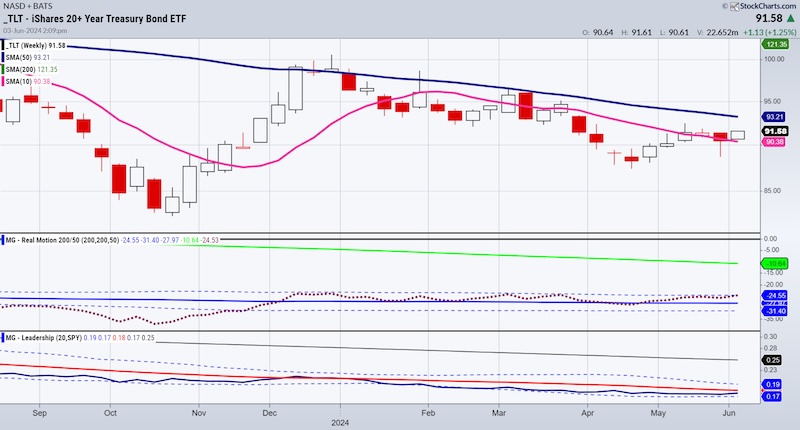
The weekly chart moves out the timeframe a bit.
TLT has not had 2 consecutive weekly closes above the 50-Week Moving Average since December 2021. HUGE-should that happen anytime soon.
The Real motion of momentum indicator has not cleared the upper Bollinger Band in a really long time. HUGE-should that happen anytime soon.
TLT has underperformed the benchmark since March 2023, when long-dated treasury bonds briefly ran up during the mini bank crisis.
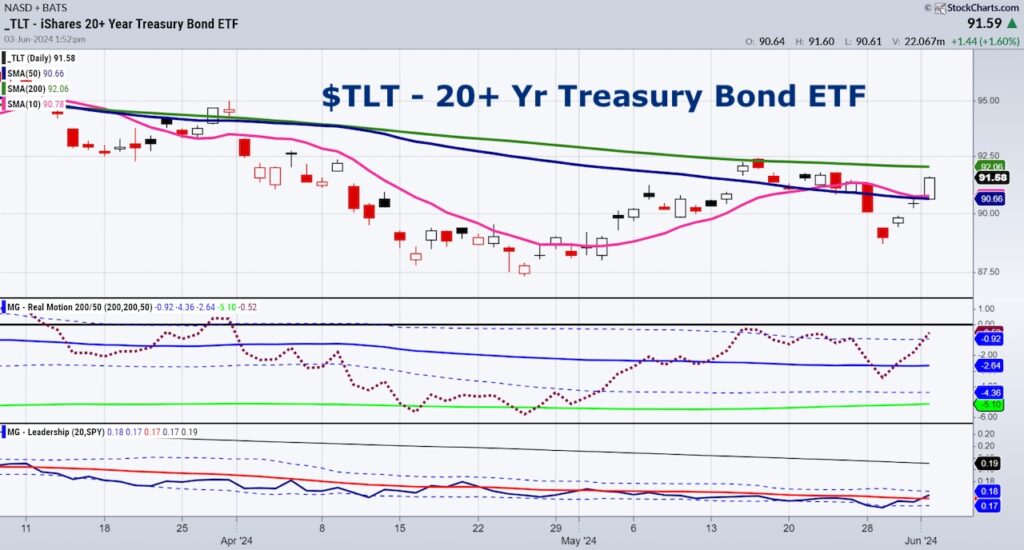
Zooming into the Daily chart, momentum is improving but still not through the horizontal black zero line.
TLT is now outperforming the benchmark, though we prefer to watch that on a weekly timeframe.
The price shows a move closer to the 200-DMA.
If you put that all together TLT will change the landscape if this rally is real.
Besides the investment opportunity in bonds, it could spell trouble for the economy and the market as the FED might choose to ignore inflation and instead, help the economy-whichCould also mean they fail at both.
Twitter: @marketminute
The author may have a position in mentioned securities at the time of publication. Any opinions expressed herein are solely those of the author and do not represent the views or opinions of any other person or entity.

: Worrisome to Broader Market?")

