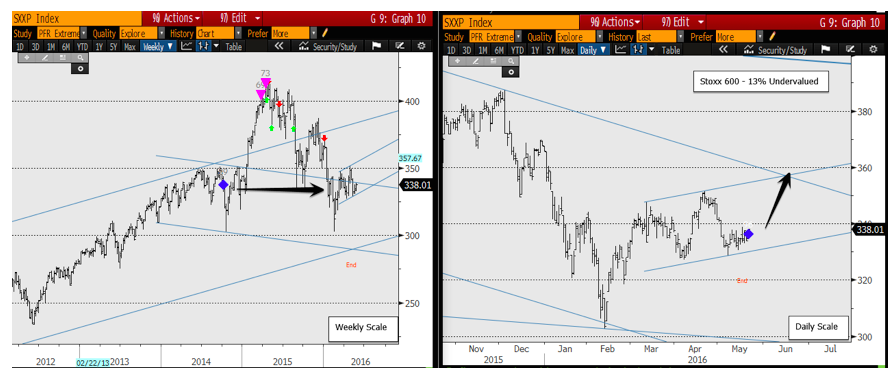
It’s been a rough go of it for European equities markets. The broadest index of European stocks (STOXX 600 Index) fell nearly 25 percent into 2016, putting in a bottom in February. The recovery has been impressive and I want to discuss the current state of the index today.
Moreover, I want to share an example of how to use quantitative and fundamental tools to gain an additional edge in trading.
Currently I believe European equities (as seen in the Euro STOXX 600 Index chart) are at a key inflection point. The Index is attempting to shake off the effects of large scale top extension from first quarter 2015. The STOXX 600 Index has been retesting its compression mid point from late 2014. This is a little known strategy that experienced users of extreme hurst are aware of: When price “retests” previous compression points, essentially the market is re-digesting a previous point of built up energy that evolved a previous strong trend move. This was a equilibrium point in the past that if it can’t reinvigorate yet another move, it will most likely resolve in the direction that it previously moved.
Additionally if we zoom in a bit to the daily scale. We can also see that this same compression signal is showing on the daily time scale. So on a even lower timescale there is a edge here that a new strong trend will commence shortly.
But the question always gets asked: Well, which way?
This is where additional science needs to be applied to further tip the scales of probability in our favor. One such non- technical tool that I have been using in broad macro forecasts is the parallax price wizard fundamental – neural network algorithm.
What is Price Wizard?
Price Wizard is a suite of industry‐scoped multi‐factor neural network equity models that were pre‐trained to convert recently reported company fundamentals into a current estimated market price. It uses no future growth expectations, analyst estimates, or price momentum. In fact, Price Wizard input factors do not include price in any form, past or present. This program automatically performs an appraisal by simultaneously using common stores of value like earnings, cash flow, book, and dividends, along with critical modifiers such as industry, margins, debt, interest rates, and inflation, to determine a price.
The Price Wizard application allows users to value equities on any global exchange, display those results on weekly, monthly, or quarterly scale charts, and then see an analysis of aggregate valuation and past performance.
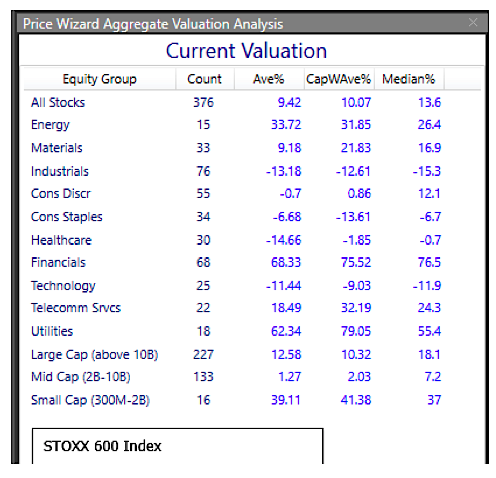
So as an overlay on qualitative tools, I can value every single stock in the STOXX 600 Index based on their fundamentals. This additional edge provides me with knowledge of when an index or even an individual stock is currently 10% or more undervalued. It (through exhaustive empirical testing) can provide up to 600 basis points or more over a broad market average (global stocks in this example).
To get even more surgical on what stocks within the Euro STOXX 600 Index might yield the best performance if this compression breaks to the upside. I can drill down even more inside each sector to see what might have the best fundamental stance currently. 13.6% — is the what the total Stoxx 600 is currently undervalued. Where as you can see that energy, utilities, telecom and European financials are the most undervalued of European equities sectors.
As I have been growing my business more towards more asset management strategies rather than trading algorithms. I have found that using many different types of non-overlapping types of technology can provide a compounding effect on the overall success of the strategy, as long as they complement each other.
I forecast that European equities will break to the upside out of this compression and trend towards the 10% -12% overvalued level over the next 12 or so months.
If you are interested in the science behind training a neural network to value stocks I have attached a white paper below that could be interesting.
Additionally I have attached a chart book of fresh extremehurst signals on individual stocks within the stoxx 600 index.
Thanks for reading.
Twitter: @interestratearb
Any opinions expressed herein are solely those of the author, and do not in any way represent the views or opinions of any other person or entity.

: Showing Some Signs of Emerging Strength")
