As we noted in a post last month, there is a strong seasonal tendency for the large caps (via the SPDR S&P 500 ETF – SPY) to outperform small caps (via the iShares Russell 2000 ETF – IWM) in the month of April. And as the month draws to a close, it looks like April seasonality has proved reliable once again, with the SPY up over 2.8% compared to IWM’s April gain of 0.6%.
Let’s review the relationship in a couple charts, then turn to May seasonality.
SPY vs IWM Performance Chart – April
For the year, small caps are still leading the large caps.
SPY vs IWM Performance Chart – YTD 2015
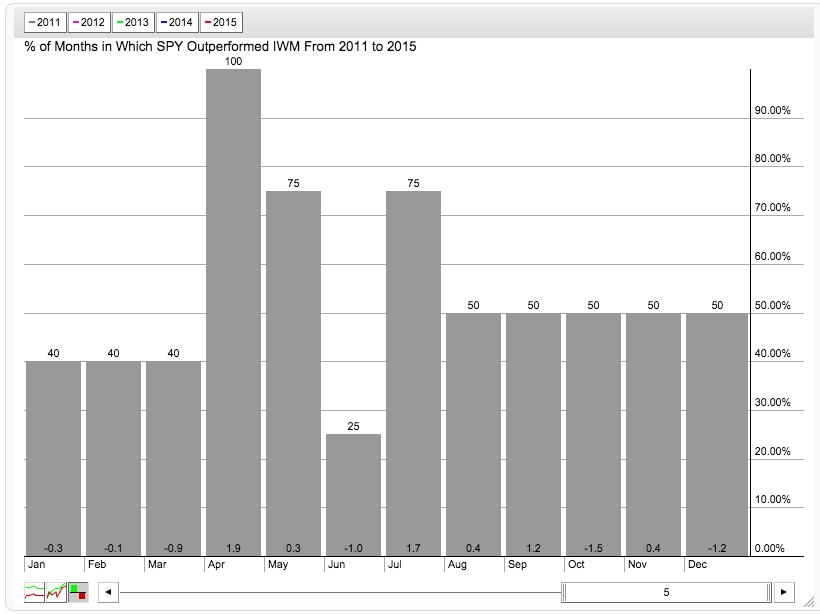
Looking ahead, May isn’t quite as unanimous in favor of the SPY but history suggests IWM underperformance in May as well. April-May is strong for large caps seasonality over the past 5 years.
Seasonality – Months In Which SPY Outperformed IWM (2011-2015)
Checking in on the ratio of SPY to IWM, we can see that the ratio is rolling over from an overbought level as measured by the RSI 7. In the recent past, this condition has been followed by muted performance in both SPY and IWM. Something to monitor in the month ahead.
SPY:IWM Relative Strength Ratio Chart
The author does not have a position in the mentioned securities. Any opinions expressed herein are solely those of the author, and do not in any way represent the views or opinions of any other person or entity.


