There is just no sugar coating it: Technology stocks are the hottest sector on the planet.
And if the broader stock market wants to keep its upside momentum, it will need tech stocks to remain a market leader.
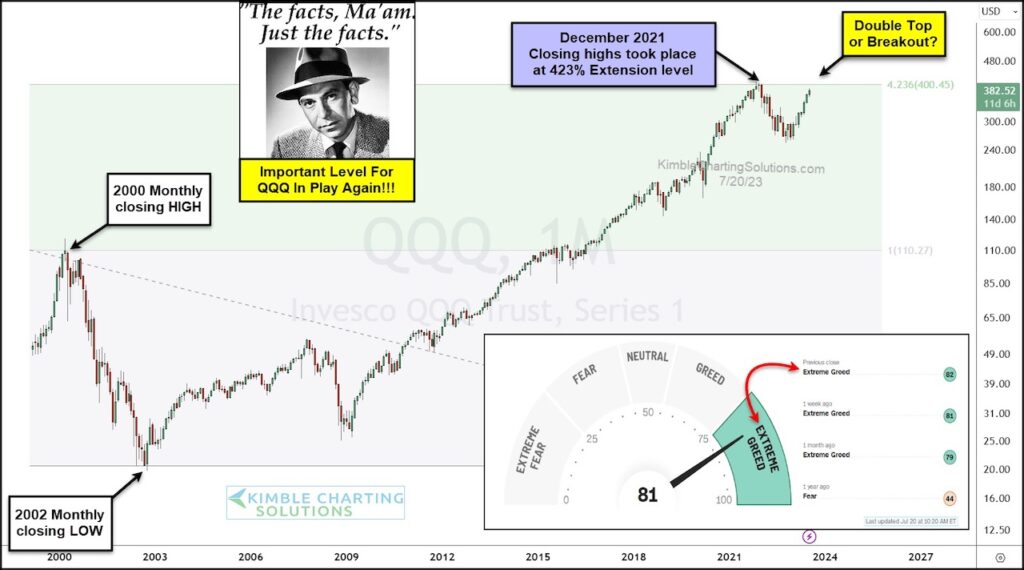
“The facts, Ma’am. Just the facts.” – Joe Friday
Today we look at a long-term “monthly” chart of the Nasdaq 100 ETF (QQQ).
And as you can see, the QQQ’s have made quite a turnaround in the past year… reversing from investor “fear” (near market lows) to investor “extreme greed” as we approach the December 2021 highs.
It is noteworthy that the prior highs formed right at the 423% Fibonacci extension level.
So with “extreme greed” in the marketplace, it will be interesting to see if large cap tech stocks stall out at double top resistance… or if they breakout (perhaps after a little pause) to new all-time highs and keep the party going.
Clearly, this is an important price point for the QQQ’s, market leadership, and the broader market. Stay tuned!
$QQQ Nasdaq 100 ETF “monthly” CHART
Note that KimbleCharting is offering a 2 week Free trial to See It Market readers. Just send me an email to services@kimblechartingsolutions.com for details to get set up.
Twitter: @KimbleCharting
Any opinions expressed herein are solely those of the author, and do not in any way represent the views or opinions of any other person or entity.


 and Semiconductors (SMH): Concerning Price Pattern?")


