Lam Research (LRCX) earnings report is impressive but its stock price is showing signs of a short-term top.
Note that I discussed LRCX in my Stock Sectors segment – “20 Overbought Stocks Ready to Correct” on 1/23/2020. Become a Level 2, 3 or 4 member to get access to our extensive library of over 500+ videos.
Lam Research (LRCX) reported earnings on January 29 after-hours.
The company reported adjusted EPS of $4.01, which beat analyst expectations of $3.86. Revenue rose to $2.58B, which also beat expectations of $2.51B. Let’s see what the charts tell us.
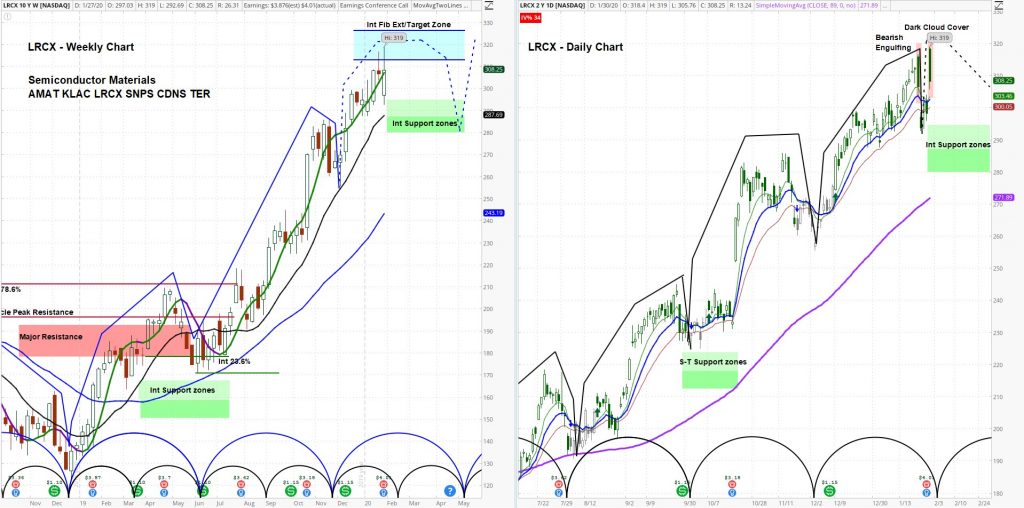
Lam Research (LRCX) Weekly and Daily Chart Grid
At askSlim.com we use technical analysis to evaluate price charts of stocks, futures, and ETF’s. We use a combination of cycle, trend and momentum chart studies, on multiple timeframes, to present a “sum of the evidence” directional outlook in time and price.
askSlim Technical Briefing: The weekly analysis suggests that LRCX is in a positive longer-term pattern but is due to have a short-term correction. Weekly momentum is positive. The daily analysis suggests that the stock is in a positive pattern but showing early signs of failure. For the stock to confirm that it has formed a short-term high, we would expect to see daily momentum turn negative. As of 1/30/2020, daily momentum remains positive.
On the upside, there is an intermediate-term Fibonacci projection/target zone from 312.92 – 326.47. On the downside, there is an intermediate-term Fibonacci support zone from 294.74– 279.76. Our analysis suggests that for the bears to regain control of the intermediate-term, we would likely need to see a weekly close below 269.09.
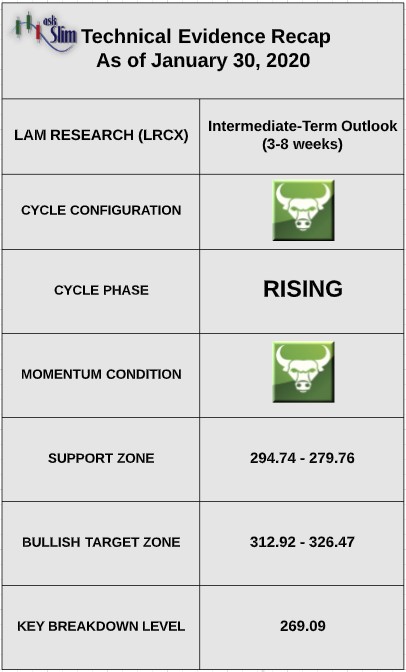
askSlim Sum of the Evidence: LRCX has a positive longer-term pattern but is due for a short-term correction. The stock is showing signs of stalling on the daily timeframe. Given the longer-term positive pattern, we would expect any downside to be limited to the intermediate-term Fibonacci supports beginning at 294.74.
Interested in askSlim?
Get professional grade technical analysis, trader education and trade planning tools at askSlim.com. Write to matt@askslim.com for special askSlim membership trial offers!
Twitter: @askslim
Any opinions expressed herein are solely those of the author, and do not in any way represent the views or opinions of any other person or entity.

 Flirting With Critical Support… Again")


