A key broad market gauge is potentially breaking a major line of support. Could this lead to a stock market correction?
If you’ve followed us for awhile, you probably know about our affinity for the Value Line Geometric Index (INDEXNYSEGIS:VALUG) as a gauge of the broader equities market.
The Value Line Geometric Index (VLG) is an equally-weighted index of approximately 1700 U.S. stocks. It’s unique in its construction as it essentially tracks the performance of the median stock in its universe. As such, its construction makes the index particularly useful in monitoring the health of the overall stock market in the U.S. And if that is indeed the case, the market may be showing the initial symptoms of getting sick.
We say this because of a troubling development on the VLG’s chart. Following the presidential election last fall, the VLG surged to a new 52-week high, challenging its all-time highs in the process. It would run out of steam in December, however, and subsequently entered into an 8-month sideways trading range.
In late July, the VLG was able to finally break out to new highs, along with a barrage of other indices. However, at least for the VLG and other small and broad market averages, the breakout proved short-lived. By the end of July, the VLG had lost its breakout position and had dropped back into the former trading range. Throughout the first half of August, if the VLG continue to slide lower within the range. During last week’s selloff, the VLG was able to hold the bottom of its trading range near 508. The index was not so lucky during yesterday’s decline.
As our Chart Of The Day shows, the Value Line Geometric Index closed yesterday below the bottom of its 8-month trading range.
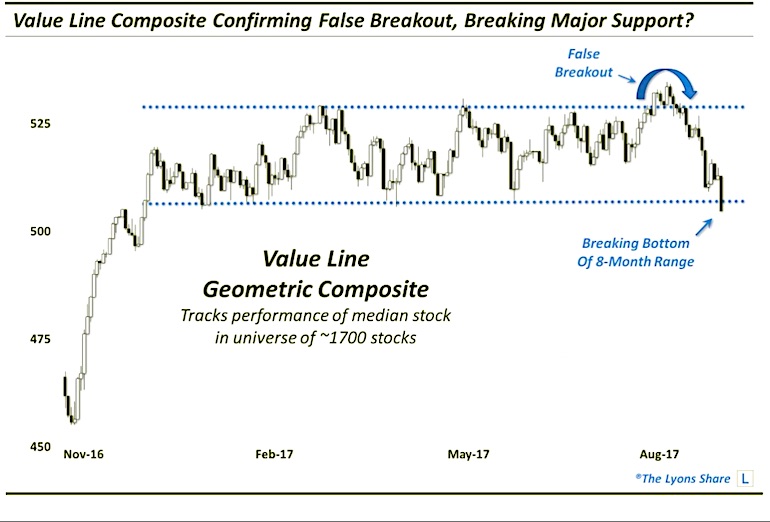
So what is the technical significance of this development? Is it the end of the road for the bull? First of all, it confirms the late-July false breakout and projects a move lower. Secondly, the loss of the range support opens the door for such a move. Just how much of a drop are we talking about? And can a recovery negate this breakdown? All things to watch in the week ahead.
If you want this “all-access” version of our charts and research, I invite you to check out my new site, The Lyons Share. Thanks for reading!
Twitter: @JLyonsFundMgmt
The author may have a position in mentioned securities at the time of publication. Any opinions expressed herein are solely those of the author, and do not in any way represent the views or opinions of any other person or entity.


