Successful traders and investors tend to watch junk bonds performance to understand when the financial market is bullish (junk bonds do well) versus when the market is bearish (junk bonds don’t do well).
Looking at today’s intermediate term “weekly” chart of Junk Bonds (JNK), it’s apparent that junk bonds have not performed as well as bulls hoped for. And this correlates to the stock market’s counter-trend rally… which has fallen well short of its highs.
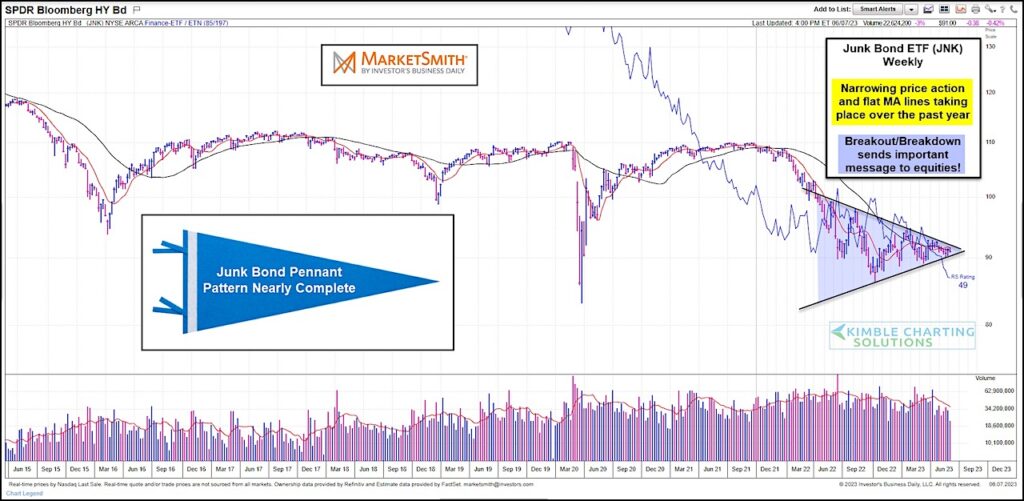
That said, nothing has been decided. And when we look at junk bonds, we see a narrowing pennant pattern that is likely to resolve soon. This pattern has developed over the past year and continues to narrow. Something has gotta give soon!
And this means investors should continue to follow this etf until the pattern resolves. The resolution to this compression pattern will send an important message to U.S. equities and global stock markets! Stay tuned!
$JNK Junk Bonds ETF “weekly” Chart
Note that KimbleCharting is offering a 2 week Free trial to See It Market readers. Just send me an email to services@kimblechartingsolutions.com for details to get set up.
Twitter: @KimbleCharting
Any opinions expressed herein are solely those of the author, and do not in any way represent the views or opinions of any other person or entity.


