Fund Flows
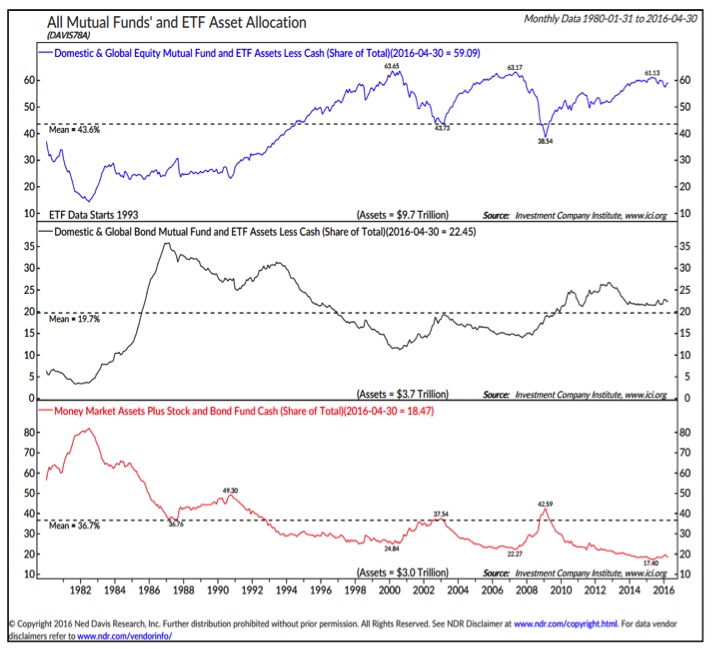
The weekly fund flow data has gotten a lot of attention lately for showing a persistent outflow from equity funds and inflow into bond funds. A look at aggregate levels of assets in stock and bond funds shows little change in exposure. This data comes from the same source (ICI) as the fund flow data, so that is not an issue. Rather, the overall level of assets (measured in trillions) is quite large relative to the weekly flow data (measured in millions and billions). Despite outflows from equities, exposure to equities remains elevated.

GOLD
Beyond stocks, other markets are in the news this week as well.
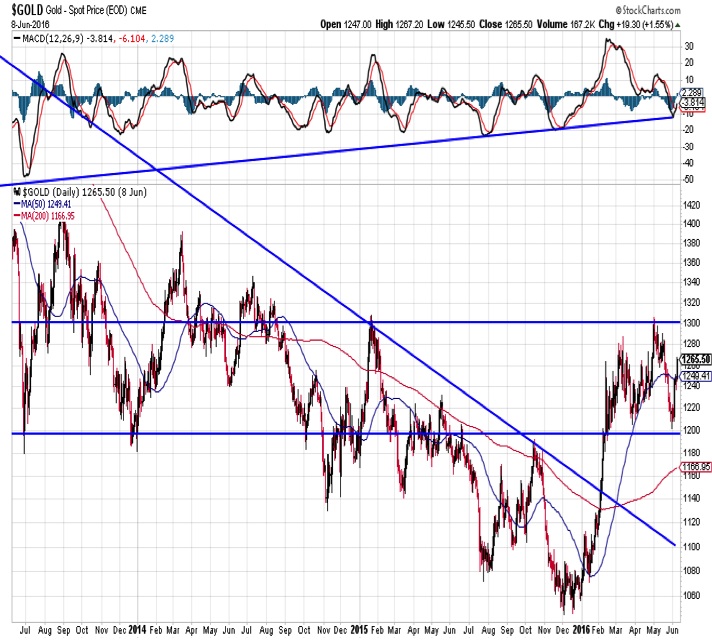
After a strong start to 2016, Gold has settled into a trading range between $1200/oz and $1300/oz. While the longer-term downtrend may have been broken, there is little evidence that a sustained up-trend has emerged. The excessive optimism in gold that emerged earlier this year is fading.
10 Year Treasury Yield
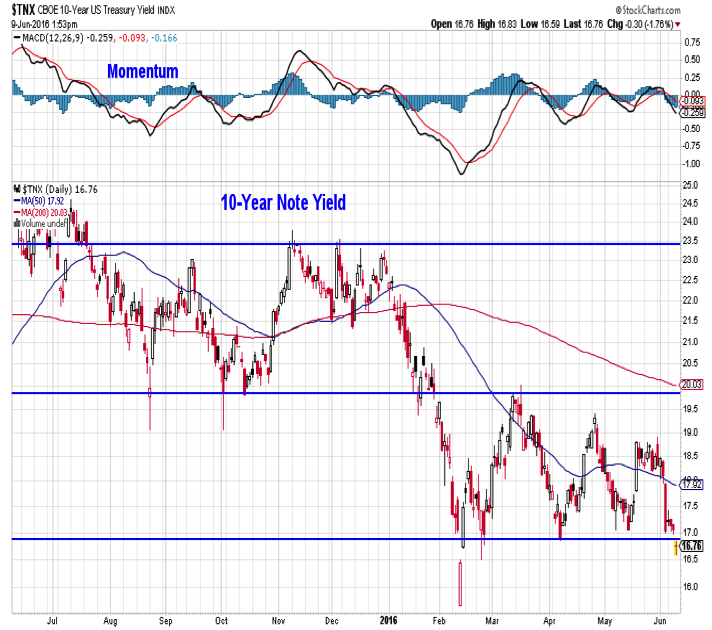
Treasury yields have moved sharply lower as expectations of a June rate hike have been reduced. The yield on the 10-year T-Note has moved below support near 1.70% and the 30-year has broken back below 2.50%. While yields have moved lower, momentum accompanying the move has been less intense than previous tests of these levels. Combined with still-widespread optimism on bonds, this could argue against a sustained drop in yields.
Utilities Sector Strength
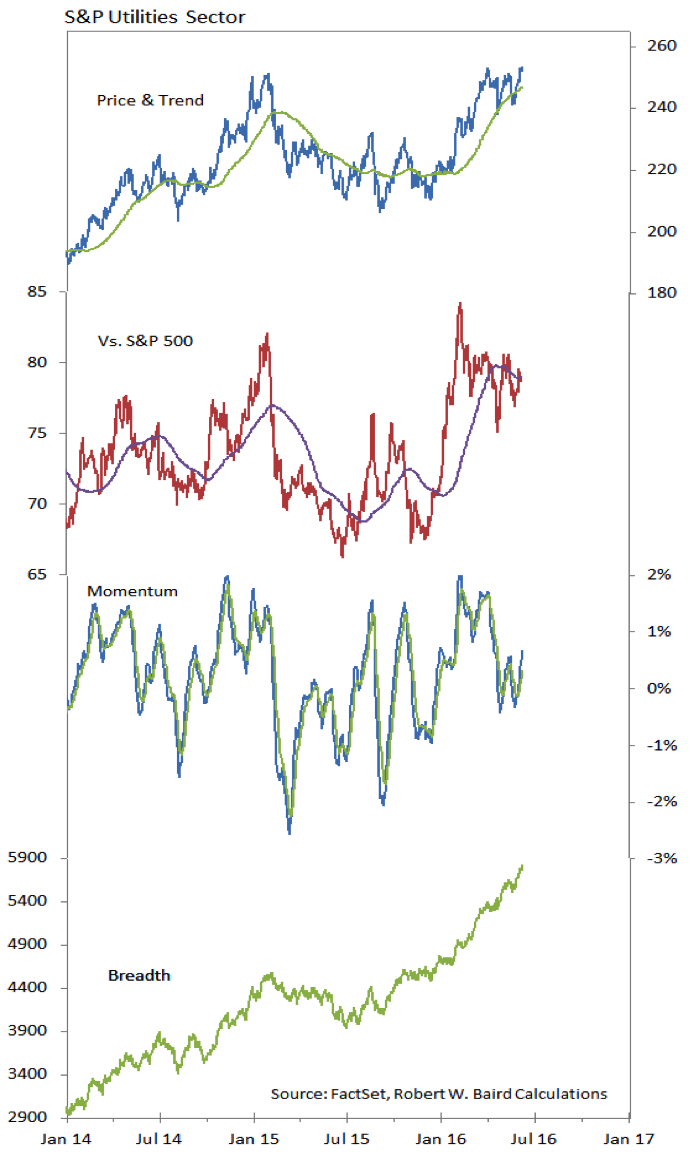
The drop in bond yields has helped provide continued interest in the Utilities sector. In last week’s Macro Update we showed the surge in flows into Utilities ETF’s. While the sector has attracted inflows and has made new price highs, on a relative basis it has lagged the S&P 500 since February. The momentum accompanying the current price highs is significantly lower than what was seen in previous rallies. In other words, while breadth remains strong and despite elevated interest, the sector is struggling to keep up with the rally seen in the broad indexes.
Thanks for reading.
Twitter: @WillieDelwiche
Any opinions expressed herein are solely those of the author, and do not in any way represent the views or opinions of any other person or entity.


