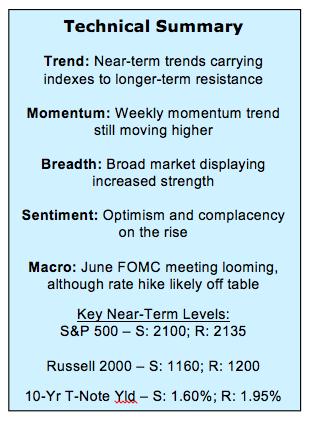
June 10 Stock Market Outlook and Technical Review
Here’s a look at some key stock market indicators and emerging themes that we are watching:
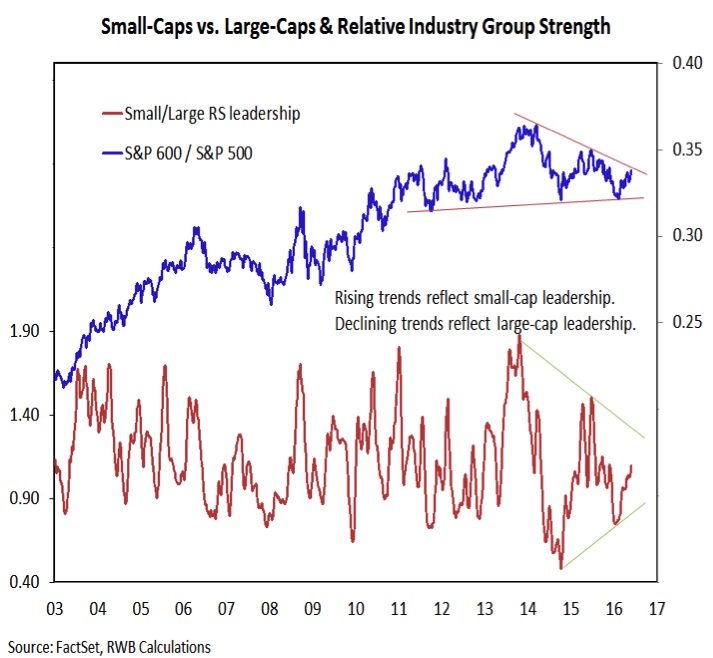
Small-Caps Find Support In Industry Group Trends – The Russell 2000 has paced the stock market rally of the mid-May lows, matching the point gain of the S&P 500 (but nearly doubling its percentage gain). Small-caps have not broken out from a longer-term trend perspective, but industry group leadership trends show small-cap groups gaining relative to large-cap groups. This is important to see if the stock market rally is to continue near-term.
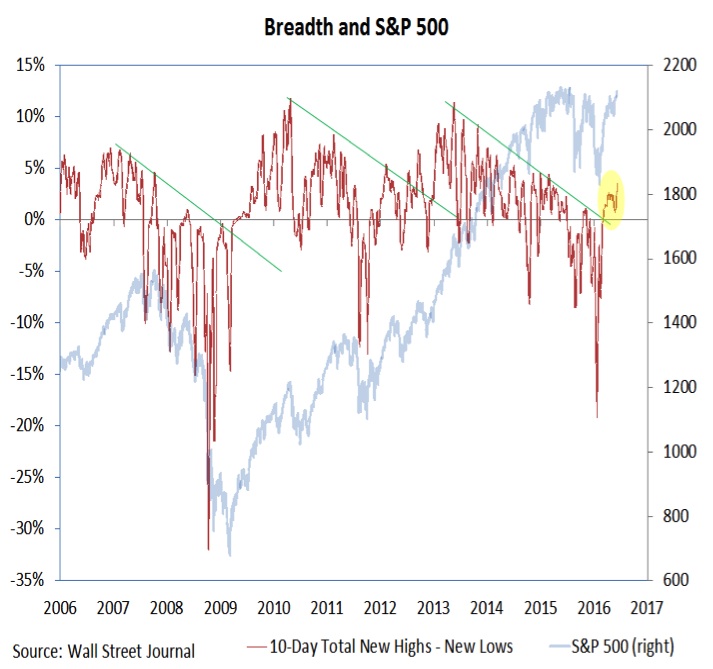
New Highs Are Lagging, But Heading In The Right Direction – Breadth indicators continue show improvement, and the focus this week is on the number of issues making new highs. While relatively low on an absolute basis, new highs have sustained a break above a down-trend and are moving in the right direction.
Despite Persistent Outflows, Exposure To Equities Remains Elevated – Fund flow data have shown outflows from equities on an almost weekly basis. While billions have moved from equities to bonds, the overall level of assets in funds is measured in trillions. Aggregate exposure to equities has eased slightly, but remains elevated.
Stock Market Indicators – Indices & Sectors (click to enlarge)
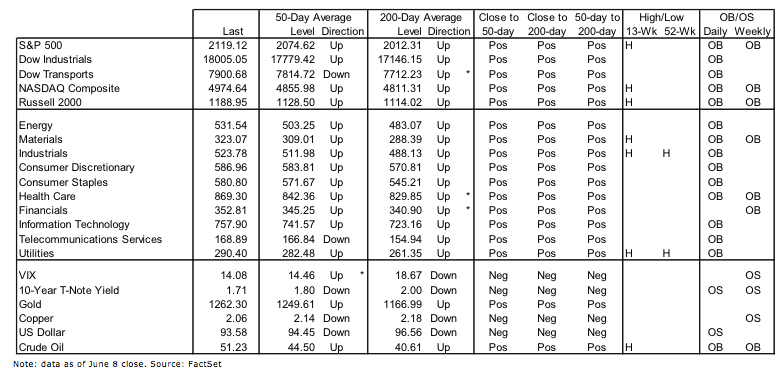
S&P 500 Index & Market Breadth
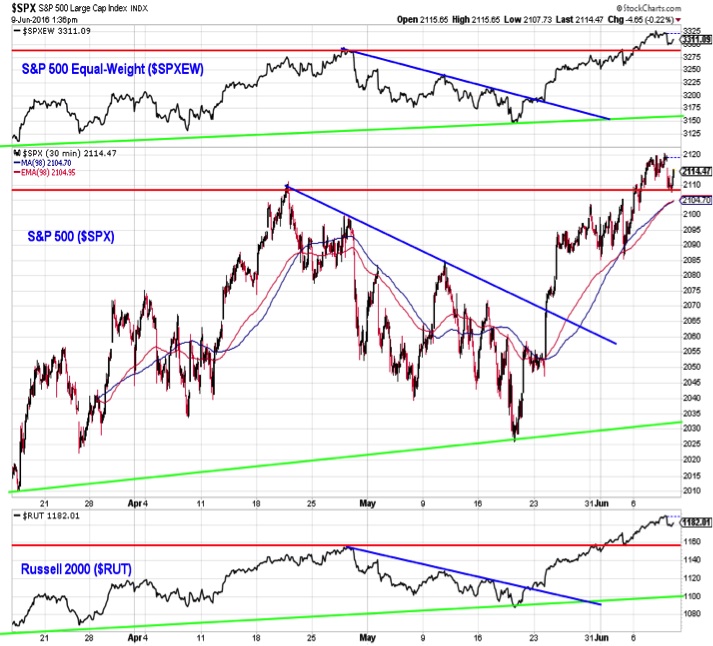
Both the S&P 500 and the Russell 2000 (and the equal-weight S&P 500 for that matter) have made higher highs and after rallying 100 points over the past three weeks, some consolidation would be neither unwelcome nor unhelpful. That being said, the allure of new all-time highs for the S&P 500 may be enough to keep the rally going for now.
The number of stocks making new highs continues to expand. After breaking above a multi-year down-trend, new highs stalled. More recently however the number has begun to move higher. While not at a high absolute level, new highs are expanding and this reflects improved rally participation versus previous times the S&P 500 traded above 2100.
Large Caps vs Small Caps
While small-caps and the Russell 2000 have led the most recent rally, the trend in the ratio between small-caps and large-caps has not yet broken out. Rather, the rally has left the ratio challenging a well-tested down-trend. Supporting a breakout in small-cap leadership is the improved relative strength leadership from small-cap industry groups versus their large-cap counterparts.
read more on the next page…


