Much attention of late has been focused, with good reason, on rising yields, falling bond prices and the collapse in the Japanese Yen not to mention Gold. But many don’t know how tightly correlated these assets are. As a strategic technical analyst, I look for macro themes (economic and fundamental) to show themselves in intermarket chart analysis.
One such theme I leveraged was “Japan as The Tell” as my trade trigger for lower gold and even the US bond market.
Before Trump There Was Japan
I’m very fond of the 10 year Treasury chart. Rates move markets! So how did I come to trade around a Thesis of Higher Yields with Japan as The Tell?
Back on Sept 21st, before Trump was elected, I wrote that I believed the 10 yr yield on JGB was just beneath the zero rate for the last time. With the BOJ setting the new cap on benchmark rates at zero, my bet was that they would defend 100 USD/YEN and that the FED would somehow ‘help’. With Japan as the world’s 3rd largest economy and our 4th largest trading partner, not to mention Bernanke advising the Bank of Japan, it seemed highly likely the U.S. would support their efforts. I found it curious how US yields and US dollar spiked soon after Japan announced they were removing monetary stimulus in the near term. Then it became obvious that the BOJ was undertaking stealth monetary policy by promising to buy up Japanese government bonds, in an unlimited amount, if they needed in order to push yields back down to zero. If it worked, this would be very good for Japanese equities and bad for Japanese Yen.
Macro Thesis: The BOJ policy to peg the Japanese 10 year government bond yield to zero was akin to unlimited QE, and that meant devaluing the yen to prop up Japanese equities. With the Yen under pressure, the US dollar would rise and that would be bad for Gold and Miners. But the correlation between USD and GLD was not technically as strong as US Yields and Gold. With that, my thesis on Gold was simple: it would lose its luster as negative world yields turned positive, making the risk/reward of holding gold less desirable over dollars.
Trade Trigger: I watched for US yields and US dollar to trigger a run. At the same time my FXY chart for the Japanese Yen triggered short October 4th. With that, I had my Trade Set-ups to go long the USD and short the FXY, TLT, GLD and GDX. Even before the election, my October Macro View was predicated on the fact that the Yen would lead bonds, gold and miners lower while higher rates would lead banks higher. And this was before Trump was elected and momentum accelerated this thesis and these trades.
Timeframe: With Japan keeping its long-term rate pegged to zero, it will likely just print Yen until it gets the inflation it wants. With this in mind, and with the bond and gold trade following the Yen script so literally, I am not a believer in a recovery of bonds and gold (TLT, USB, GLD, GDX, etc) until my “Japan as The Tell” plays itself out or fails.
Follow The Yen and US Dollar
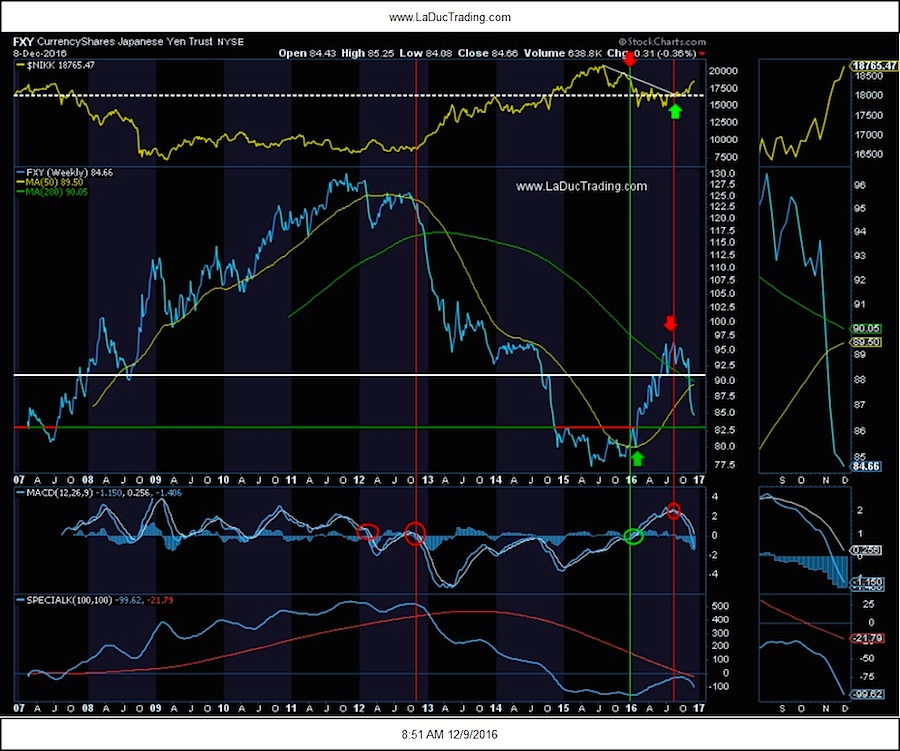
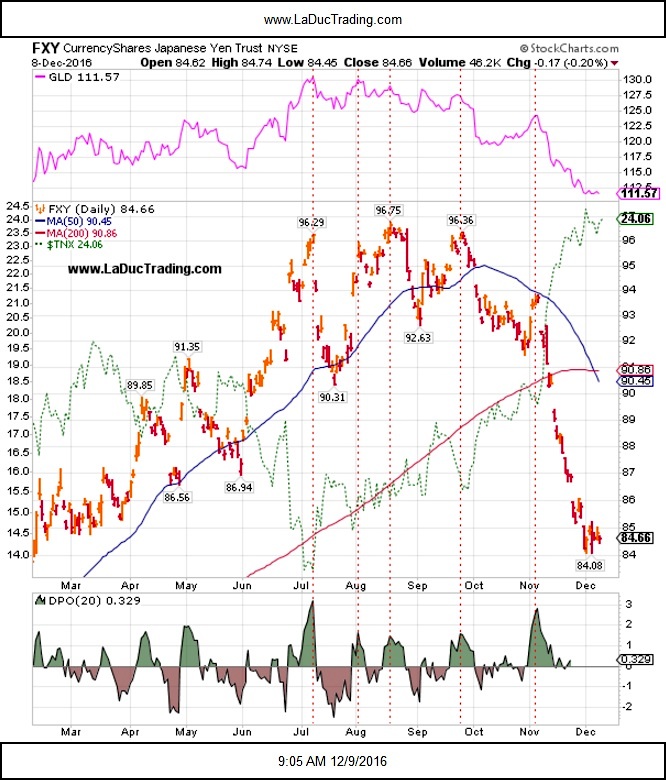
I like to pullback in time to spot price patterns on charts. This weekly chart of FXY (the ETF for the Japanese Yen) behaved very technically from the moving average crossovers at both the ~$125 top and $80 bottom area as well as the head & shoulder formation in the $96-94 area this summer. The MACD crossover combined with my macro thesis helped me keep eyes on the prize. The daily chart of FXY was foretelling a nice short on Oct 2nd at the $95 level. It had tested its 50 day moving average seven times in 2016 so the probability that it would break was gaining in my mind. It did in fact break support and the downward move accelerated when Trump was elected, falling 7% in 2 weeks, the largest 2-week decline in its history. Now, it is approaching support around $82.50, which should serve as a digestion area for this outsized move.
Needless to say, the Yen short thesis corresponded well with a long Japanese equities theme.
- Since Nov. 8 alone, the Nikkei average added 1,200 points, or 10%.
- Credit Suisse upgraded Japanese equities to “overweight” and raised its Nikkei average outlook to 20,000 for the middle of 2017.
- Foreigners bought over 890 billion yen worth of shares on a net basis during the second and third week of November.
My focus was on the Bond/Gold short thesis however. Here is my cycle work on Gold (pink), Yen (red) and corresponding 10 year Treasury Yield (green) that helped me gain confidence and better position entries/exits in my basket trading approach.
continue reading on the next page…


