If the Dollar Index makes a significant low near its present area, it would create a favorable environment for bearish trades in paired currencies such as the Yen and the Euro.
This week’s article presents two Elliott wave scenarios for the Invesco Currencyshares Japanese Yen Trust (NYSEARCA:FXY) that would take price to a new low in 2024.
FXY began moving out of a multi-year triangle consolidation in January 2021. As expected, the decline has the forceful appearance of an impulsive pattern, but we don’t believe the move is complete yet. The fifth and final sub-wave (v) of the impulse should reach a new low beneath 61.60, but it’s unclear whether the sub-wave has begun yet.
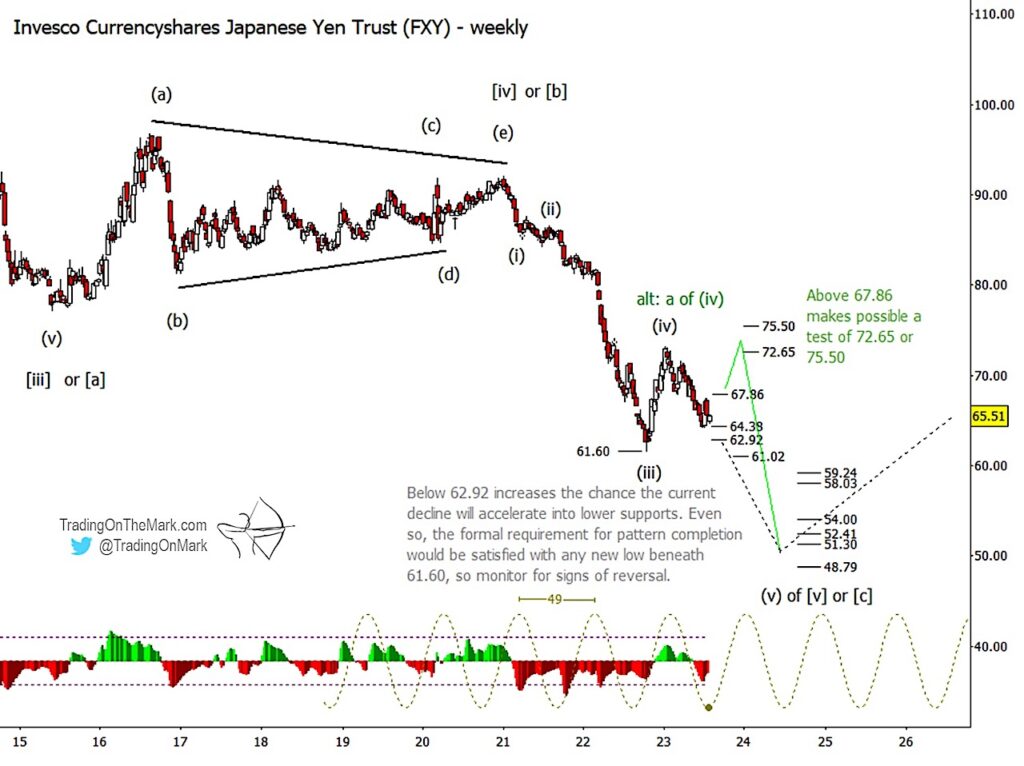
Our primary scenario treats the rally from October 2022 as the fourth wave in the impulsive decline, which would lead to the path depicted approximately by the black dotted line on the weekly chart.
The next best alternative scenario treats last year’s rally as merely the first part of the fourth wave – or sub-wave ‘a’ of (iv) – which makes possible another rally in sub-wave ‘c’ of (iv) that could start from the nearby support zone around 64.38 or 62.92. The alternative path is shown in green.
We note that the adaptive CCI momentum indicator shows FXY as being a bit oversold, and it comes in conjunction with a low in the 49-week cycle. However we do not yet see the kind of momentum divergence that often appears at major turns. This combination of factors suggests the possibility of a modest upward retrace from near the 64.38 support area, allowing for a test of resistance around 67.86 or near the mid-July high which was slightly lower. That’s where the market could make a decision about whether to take FXY above the first resistance level and thus render this year’s decline as merely a corrective ‘b’ sub-wave inside wave (iv).
A break and weekly close above 67.86 would allow a rally to continue upward as sub-wave ‘c’, which could aim for resistance near 72.65 or 75.50, consistent with the alternative scenario. Conversely a break and weekly close beneath 62.92 makes it more likely FXY will continue bumping its way downward through supports. A close beneath 61.02 would offer additional confirmation for the main bearish scenario.
If either the primary or alternative bearish scenario prevails, there’s still an important caution to keep in mind. At this point ANY new low beneath 61.60 would satisfy the formal requirement for the fifth sub-wave of the decline. Thus it’s conceivable that FXY could make a brief test of support at 61.02 and then start climbing relentlessly in the next major phase of its pattern. Instead we believe it’s more likely that FXY will travel beneath the support area for several months, but it will be important for any bearish traders to monitor for upward reversal signals on weekly and daily time frames.
Other support areas to watch for an eventual low include the zone from 59.24 to 58.03 and the zone from 54.00 to 51.30. A stretch goal for bears sits at 48.79.
A third alternative scenario, not drawn on the chart, would treat the October 2022 test of 61.60 as the conclusion of the decline and a durable low. We believe this is the least likely of the three scenarios presented here.
Trading On The Mark uses technical analysis to identify the trends and turns in highly traded markets for commodities, energy, currency, bonds and indices. Visit their website for more charts, and follow Trading On The Mark for updates and special offers.
Twitter: @TradingOnMark
The authors may have a position in the mentioned securities at the time of publication. Any opinions expressed herein are solely those of the author, and do not in any way represent the views or opinions of any other person or entity.

: Showing Some Signs of Emerging Strength")
