 By Andrew Nyquist
Just as one should never be short a dull market, one should also be weary of being long a lullaby… Once you get hooked into snooze-control, it’s easy to get caught looking up. And the past few days, and especially this morning, are evidence of this. But now that the market is on day 3 of this “pullback,” an important question lingers: Is this the start of something larger, or just a sharp 1-2-3 day pullback?
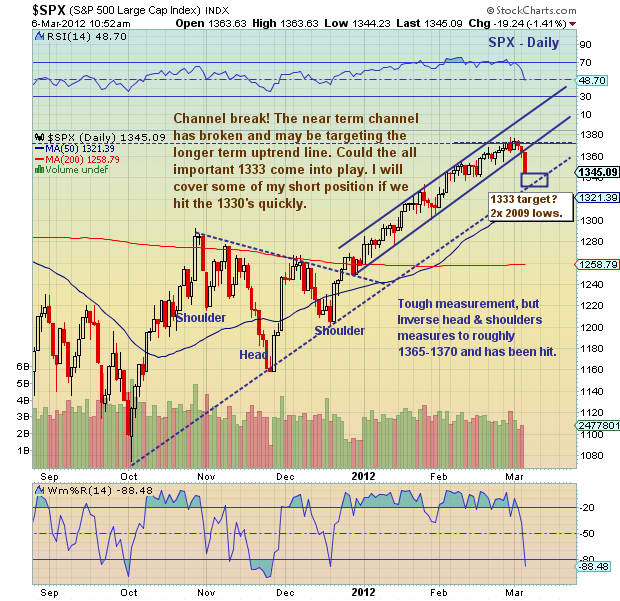
Well first and foremost, the signs for a pullback were there, you just had to be aware of them… or allow yourself to be aware of them. Being aware doesn’t mean traders/investors go out and sell everything, but rather it means we set tighter stops, respect the trend lines, and look for divergences. Two things that I wrote about recently were the VIX divergence and the Russell 2000 underperformance. Both were occurring under the surface as the market began to snooze. Also of note was the breakdown in the Dow Transports and my often-discussed 1365-1370 target on the S&P 500 inverse head and shoulders pattern. These are just a few examples. Keeping a tighter technical lens gets harder as complacency sets in, but days like this remind you why we focus on technical levels and correlations.
Speaking of, and honing in on the charts, the S&P 500 broke down and out of its 3 month bullish channel today and may now be targeting the longer term uptrend line from the Oct 4th bottom this also coincides with the 1333 level, which represents 2 times the 2009 bottom of 666.79 – Note also that 1333.47 was the high in January. I lightened up on my short index funds this morning (I took 1/3 off), and will take another 1/3 off when we get into the 1330’s. This is called trading around a core position (in February I wrote about The Messy Art of Trading Around). The character of the market here will determine the depth of the initial thrust lower (i.e. a break through 1333 would indicate a change in trend).
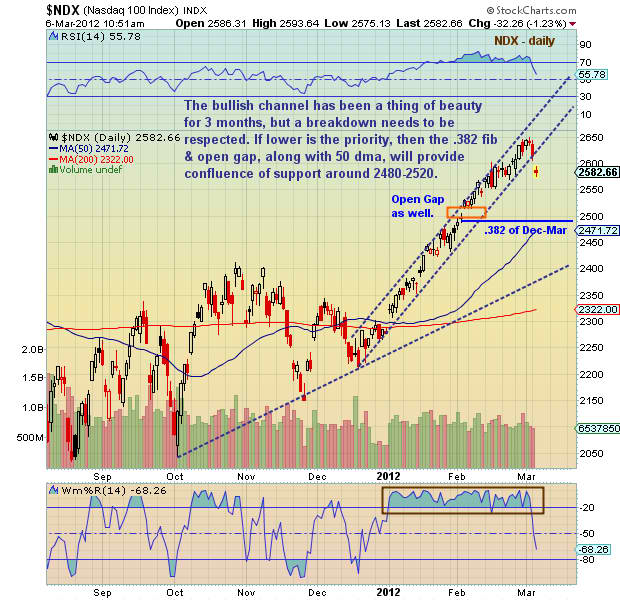
Similar patterning for the Nasdaq 100 chart, although it broke out of a steeper trend and may have further to fall to find firm support. The 2500 area looks like a good support level (.382 Fibonacci retrace, open gap, and rising 50 day moving average).
In any event, note that trend line breaks often elicit quick down moves (in a matter of days), which are followed by a backtest. A backtest is where the price comes back up towards the broken trend line (or old highs). Depending on the desire of the bulls, it can even result in marginal new highs. I’ll try to get a post together later this week on backtesting. Either way, I will look to add back to my short index fund position on the backtest, depending on the character of the backtest. Good luck and happy investing.
———————————————————
Your comments and emails are welcome. Readers can contact me directly at andrew@seeitmarket.com or follow me on Twitter on @andrewnyquist or @seeitmarket. For current news and updates, be sure to “Like” See It Market on Facebook. Thank you.
Position in S&P 500 and Nasdaq related short index funds SH & PSQ.
Any opinions expressed herein are solely those of the author, and do not in any way represent the views or opinions of his employer or any other person or entity.


