Key Stock Market Takeaways:
– Broader stock market is absorbing the selling pressure.
– Investor sentiment is seeing an uneven pullback from excessive optimism .
– The presidential election adding noise and uncertainty
With the news dominated right now by COVID and conflagrations (real and metaphorical), discussing the healthiness (or is it healthfulness) of stock market corrections might feel like an indelicate distraction.
But clarifying uncertainty where we can is a bit of a calling – so while emotions are running hot, our encouragement is to calm down, look past the noise of the headlines and see what, if anything, has changed where it matters.
This week’s commentary does that through the lens of the market, next week’s update will look at the impact of recent macro developments.
In an update last week, we reminded readers that while volatility could rise, the still neutral message from the weight of the evidence suggested a shift to more defensive posture was premature.
The market swings since that update (including a 3-day, 7% decline for the S&P 500) have not changed the message. The question that is now being asked is to what extent this is a healthy correction vs. the start of a more substantial downturn. We do not have evidence to suggest it is more than the former at this point.
However, to remain healthy, a correction will need to provide an unwind of the excessive optimism that emerged over the course of the summer before damage is done beneath the surface of the market. A correction that does not see concern replace complacency and/or significantly damages underlying breadth trends could hardly be considered healthy.
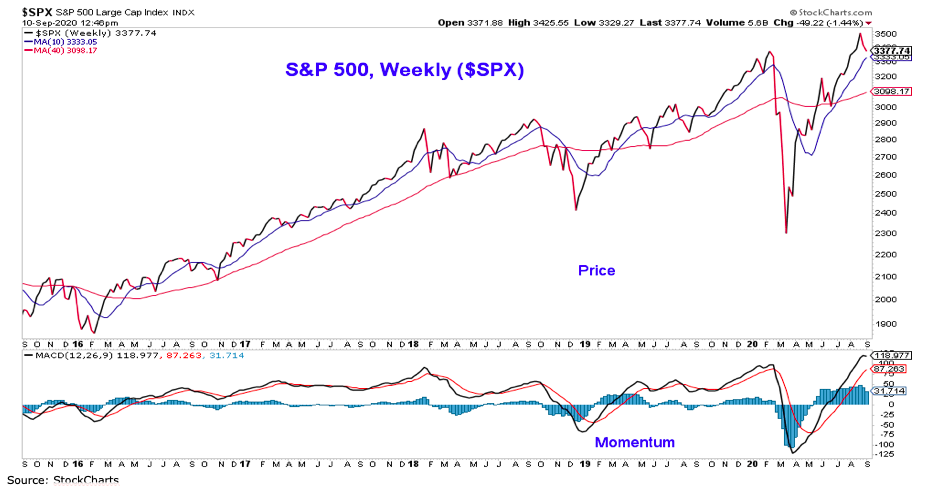
While the market is barely a week removed from all-time highs, we can still monitor sentiment, breadth and trend developments for evidence that support or refute the view that this correction is on track to remain “healthy.” As we have mentioned in the past, with a handful of mega-caps responsible for so much of the S&P 500’s recent gains, we want to keep an eye on index-level momentum as much as breadth. The chart on the previous page shows that from a weekly perspective, the momentum up-trend remains intact. Looking at global rally participation, the percentage of markets above their 50-day averages has contracted. This trend emerged over the second half of August and if it continues, could weaken the argument that breadth remains on solid footing.
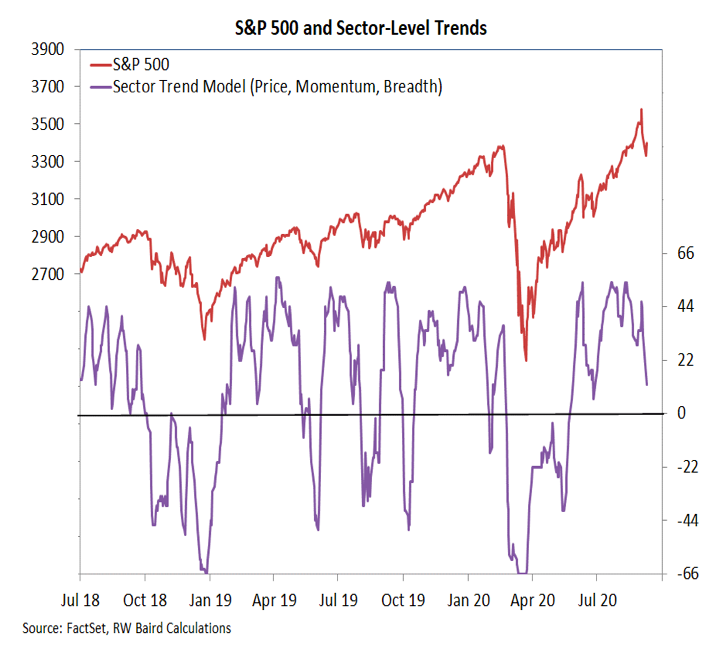
While selling pressure has been focused on mega-cap high-flyers, domestic breadth trends have not been immune to damage during this pullback. The NASDAQ composite suffered a 10% three-day decline that left fewer than half its stocks above their 200-day averages and only 37% above their 50-day averages. Our sector-level trend indicator had started to tick higher prior to this sell-off and remains in positive territory. The risk of a more significant (i.e., less “healthy”) pullback increases if sector-level trends turn negative. Breadth is absorbing the selling so far, but we continue to watch closely.
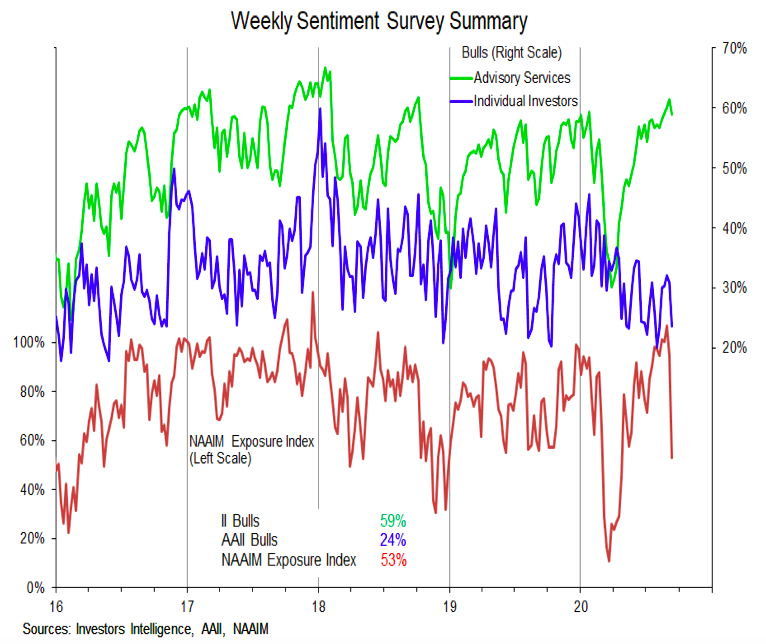
Sentiment indicators show some evidence of more caution from investors. The individual investors surveyed by the AAII who were already bearish became even more so, and the NAAIM Exposure index (which tracks sentiment among active investment managers) posted its second largest single-week decline in the history of the survey. While not pessimism, this does point to an encouragingly rapid unwind in optimism. Advisory services remain overwhelmingly bullish and the sentiment composites constructed by Ned Davis Research have only begun to move out of the excessive optimism zone. More stability from the broad market as sentiment continues to show more caution would bolster the view that the correction’s health has not taken a turn for the worse.
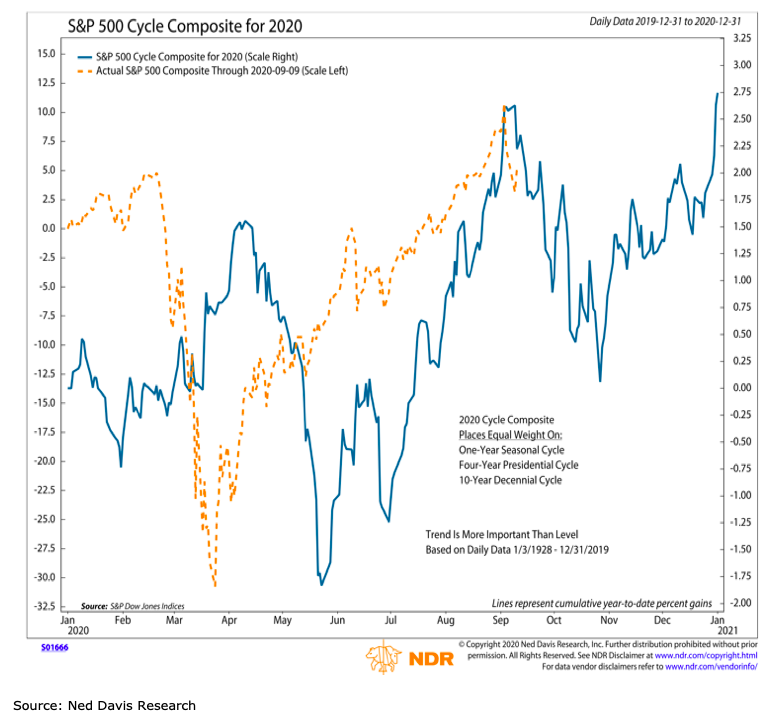
While the final outcome of the Presidential election may not have much impact on the stock market, getting to the point of electoral resolution can add volatility ahead of November 3. If the outcome is in doubt after that, the risk of more meaningful weakness could increase. There are plenty of studies and statistics showing what has happened around previous elections, but the 2020 experience seems poised to test the limits of the usefulness of those comparisons. We’ll rely on history as a guide, but tread the path lightly when it comes to the specifics about outcomes. The election is adding uncertainty and that is fueling volatility. That may be a sufficient analysis in our current situation. The cycle composite suggest a seasonal headwind into the election and a relief tailwind (assuming a clear victor) after the election.
Twitter: @WillieDelwiche
Any opinions expressed herein are solely those of the author, and do not in any way represent the views or opinions of any other person or entity.


