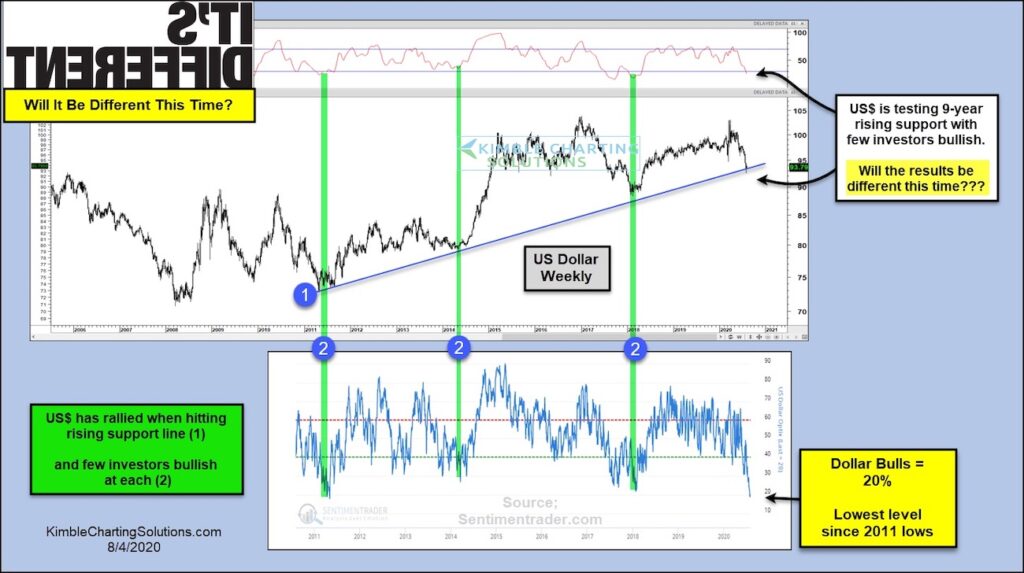
US Dollar Index “weekly” Currency Chart
The U.S. Dollar ran into a perfect storm in 2020: a pandemic (Coronavirus), an easy Federal Reserve, and trillions of dollars in government stimulus.
The result has been a steep decline in the greenback.
Looking at today’s chart, however, suggests that the US Dollar may be nearing a bottom. That is, if recent history proves true.
The Dollar is testing its 9 year bullish up-trend support at (1) and US Dollar bulls are disappearing. In fact, investors are the least bullish the US Dollars (20% bulls) since 2011 at (2). Notice that each time the Dollar tested support with few Dollar bulls, it rallied higher.
Time for a rally? Or will this time be different?
Note that KimbleCharting is offering a 2 week Free trial to See It Market readers. Just send me an email to services@kimblechartingsolutions.com for details to get set up.
Twitter: @KimbleCharting
Any opinions expressed herein are solely those of the author, and do not in any way represent the views or opinions of any other person or entity.

: Showing Some Signs of Emerging Strength")
