The U.S. Dollar got hit hard in 2020, declining nearly 7 percent (year over year) and as much as 12 percent from peak to trough during year.
This weakness in King Dollar has been a tailwind for commodities and stocks alike. See my recent articles on Silver out-performance as well as the Dow Industrials rally reaching key Fib level.
But just as we turn the page to a brand new year and look ahead to 2021, the US Dollar is nearing another inflection point.
Sink or Swim Time For King Dollar
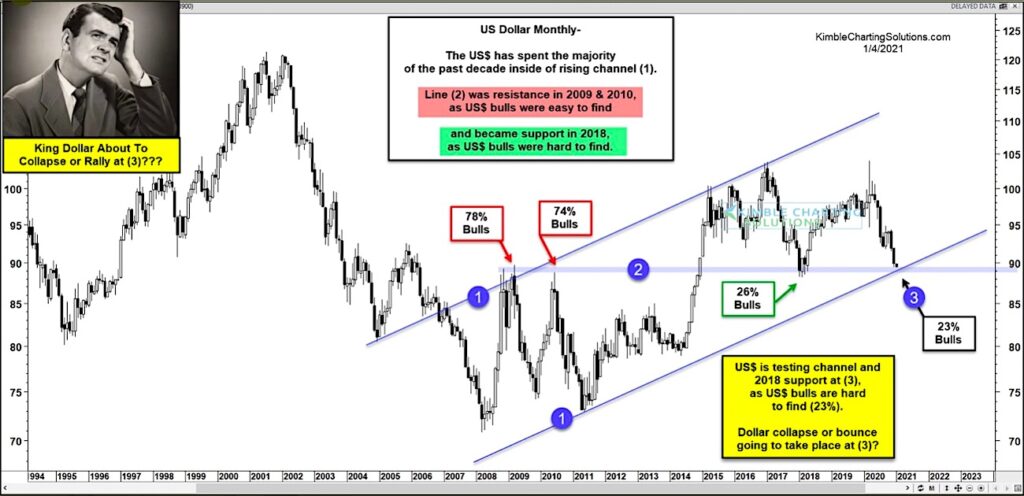
Turning to today’s “monthly” chart of the US Dollar Index, we can see that King Dollar has spent much of the past decade in a rising channel marked by each (1). However, recent weakness has taken the Dollar back down to an important confluence of support marked by its 2018 lows and 2009 and 2010 highs at (2), coupled with its lower channel trend line at (3).
Note as well that when traders are too bullish the US Dollar, it tops (such as 2009 and 2010 with 78% and 74%)… and when they are too bearish, it bottoms (like 2018 at 26%). The current reading is 23% bulls.
Humbly speaking, it looks like the US Dollar is nearing a heck of an important price point at (3)! Stay tuned!
US Dollar Index “monthly” Chart
Note that KimbleCharting is offering a 2 week Free trial to See It Market readers. Just send me an email to services@kimblechartingsolutions.com for details to get set up.
Twitter: @KimbleCharting
Any opinions expressed herein are solely those of the author, and do not in any way represent the views or opinions of any other person or entity.


