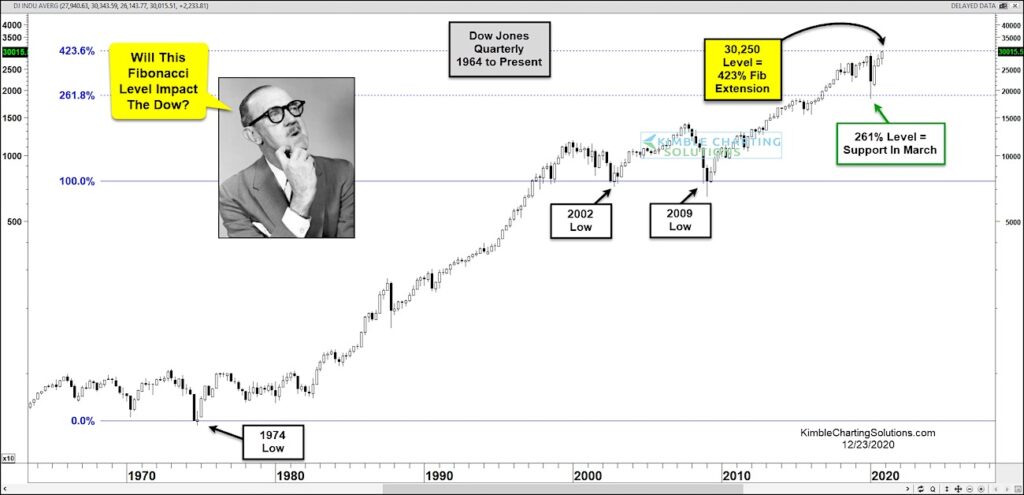
It’s truly amazing how important Fibonacci retracement and extension price levels are… and there’s no better place to highlight them than on a chart!
Today we look at a long-term “quarterly” chart of the Dow Jones Industrial Average (since 1964). Using 1974 as a major “quarterly” low and measuring that to the 2002 and 2009 major lows, we can draw out Fibonacci extensions to 261.8% and 423.6% price levels.
Here we can see that the 261.8% price level served as resistance for several quarters before becoming support… a support that held as a “low” this past March… perhaps another major low.
From there, the Dow Industrials surged higher and are currently testing another major “quarterly” Fibonacci extension level (the 423.6% Fib) at 30,250.
Will This Fibonacci price level impact the Dow Industrials? Stay tuned!
Note that KimbleCharting is offering a 2 week Free trial to See It Market readers. Just send me an email to services@kimblechartingsolutions.com for details to get set up.
Twitter: @KimbleCharting
Any opinions expressed herein are solely those of the author, and do not in any way represent the views or opinions of any other person or entity.

: Showing Some Signs of Emerging Strength")

