For the past two weeks, the market has been trending lower.
With certain sectors sitting in oversold territory, we could be ready for a pop-up in price.
However, this is a tricky spot since a rally would be right into a resistance area.
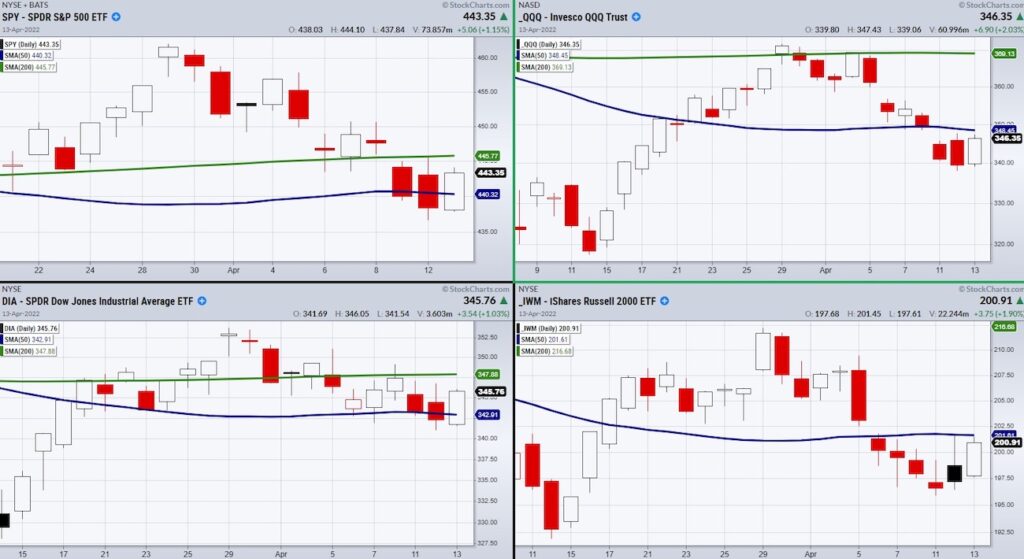
As seen in the above chart, two of the major indices are near resistance from the 50-Day moving average (blue line), while other two have resistance from the 200-DMA (green line).
With that said, if these major moving averages are cleared, we could see a quick turnaround not only in the indices but for some of the oversold sectors such as regional banking (KRE), transportation (IYT), and semiconductors (SMH).
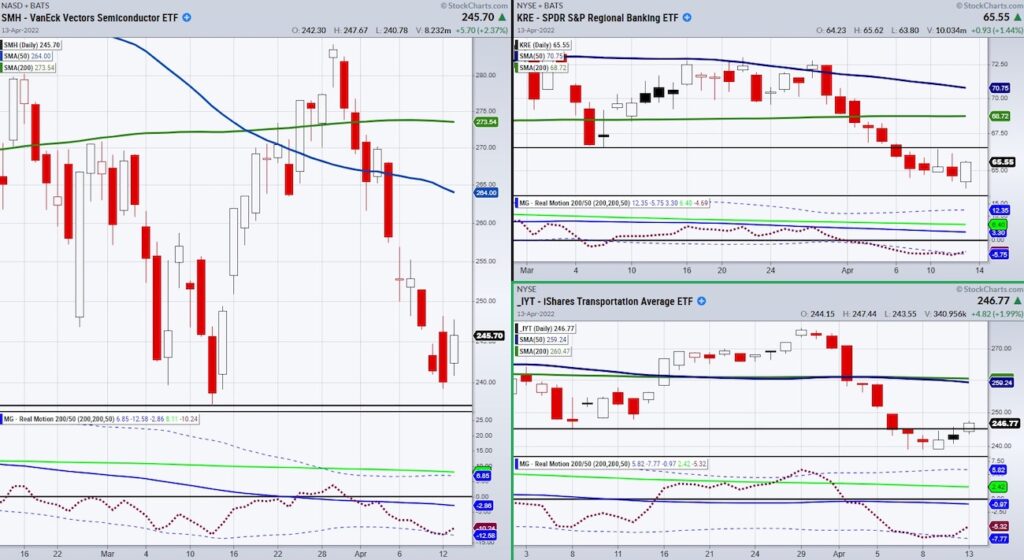
Currently, KRE is the weakest as it needs to get back over resistance from a prior low at $66.85.
On the other hand, IYT is currently holding minor support from $245.34, while SMH is over major support from $237.
From a momentum standpoint, notice how all three held their lower band on our Real Motion indicator.
This can be seen with the red dotted line holding over the blue dotted line.
This is another sign that we could get another pop in price as momentum has not fully broken down.
So where is the trap?
While these could be great short-term reversal plays, we need to watch out for a quick move over resistance followed by a surge of selling.
Because the market picture still looks heavy with increasing inflation and pending issues with the Ukraine war, we need to be careful that the market doesn’t suck people in before moving lower.
Therefore, watch how the indices behave once they clear the 50-DMA.
If the volume in the indices is low on a move higher, be very cautious.
Watch Mish’s most recent appearance on Fox Business with Charles Payne!
Stock Market ETFs Trading Analysis & Summary:
S&P 500 (SPY) 441 needs to hold for bulls.
Russell 2000 (IWM) 201 is price level to clear.
Dow Jones Industrials (DIA) 343 is pivotal price area.
Nasdaq (QQQ) 348 is price level to clear.
KRE (Regional Banks) 66.85 is price level to clear.
SMH (Semiconductors) 237 is price support.
IYT (Transportation) Watching to see if it stays over 243.
IBB (Biotechnology) 128 is price support.
XRT (Retail) Needs to clear 77.22
Twitter: @marketminute
The author may have a position in mentioned securities at the time of publication. Any opinions expressed herein are solely those of the author and do not represent the views or opinions of any other person or entity.


