On Tuesday, the stock market attempted a recovery with an initial gap higher followed by choppy price action throughout the day.
Because the market is not selling off like it did early Monday, this is showing that the market is having trouble bouncing back quickly.
For the past week the media continues to push the idea that dip buying is the best plan right now as this strategy has worked well throughout the year.
However, timing a market entry has not been so easy as traders who watched the 50-day moving average as an important support level for a dip entry were proven wrong from Monday’s gap lower.
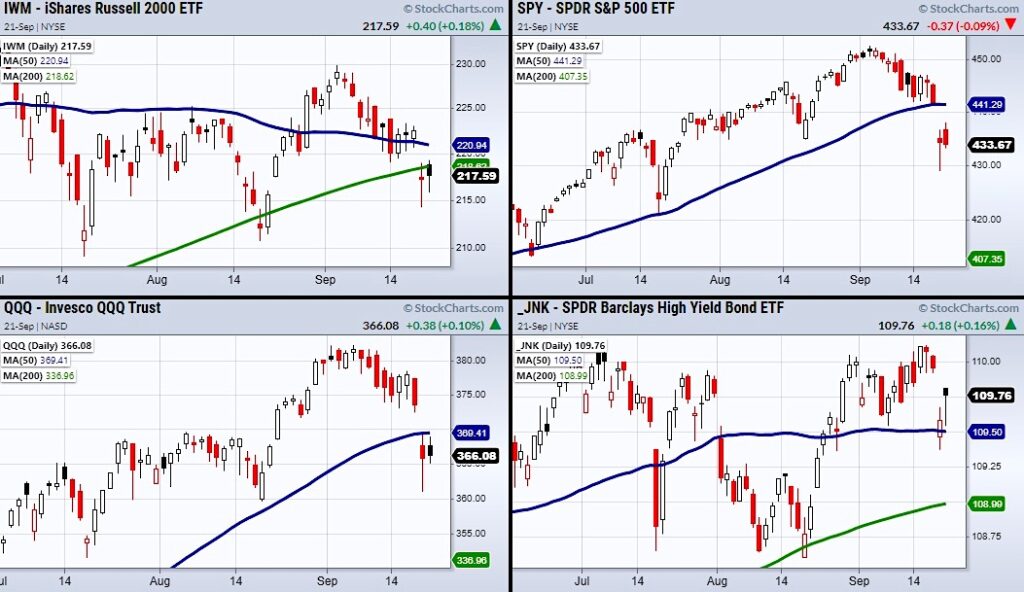
As seen in the charts above, the S&P 500 (SPY), Nasdaq 100 (QQQ), and the Russell 2000 (IWM) all gapped under their 50-DMA’s on Monday.
Looking back in the SPY, dip buyers have prominently bought while the SPY traded near its 50-DMA.
Although price failed to hold the 50-DMA in the SPY, Monday supplied a new round of buyers as the market rallied near the end of the day.
Here is the problem—if we look back at the prior dips in the indices, they were quickly followed by large green days.
Current price action is a flimsier with large range days paired with relatively week closing prices.
With that said, on Wednesday an FOMC Announcement will be made along with a Fed press conference.
The market may be holding its breath before the meeting and waiting for clarity or more dovish Fed talk as a reason to rally higher.
On another note, High Yield Bonds (JNK) is showing strength through this current pullback as it has not closed underneath its 50-DMA.
JNK can act as a risk on indicator as strength in this ETF shows that investors are still willing to take on risky corporate debt.
So, while we have a green light from the High Yield debt ETF, we need to be careful with weaker than average price action along with potentially pivotal Fed announcements on Wednesday.
Stock Market ETFs Trading Analysis and Summary:
S&P 500 (SPY) Needs to hold over 436.56.
Russell 2000 (IWM) Resistance the 200-DMA at 219.
Dow Jones Industrial Average (DIA) 332 next support level. 345.06 gap to fill.
Nasdaq 100 (QQQ) 369.80 minor resistance.
KRE (Regional Banks) Sitting in support area. Needs to hold over 60.88.
SMH (Semiconductors) Sitting on the 50-DMA at 265.
IYT (Transportation) 241.25 now minor support. 250 resistance.
IBB (Biotechnology) 169.2 the 50-DMA.
XRT (Retail) 91.14 support area. Looking weaker with downward slopping 50-DMA.
Twitter: @marketminute
The author may have a position in mentioned securities at the time of publication. Any opinions expressed herein are solely those of the author and do not represent the views or opinions of any other person or entity.


