The new year has ushered in a wave of volatility for equities markets. The S&P 500 is in correction-mode, and indexes like the Nasdaq 100 and Russell 2000 have fared even worse.
This past Monday, we saw a spike low across the main U.S. stock market indexes. And that low has held thus far.
So now the question is, is that the bottom? Is the stock market correction over?
Well, while I can offer my analysis and opinion on that (I think we bounce a bit, then turn back lower in late February/early March), I think it’s always wise to understand were key support levels are. Today, we will simply focus on one facet of that: Fibonacci levels. The charts below were shared on Twitter (@andrewnyquist) earlier today.
Note that Fibonacci levels are great to use on the way up as well (for instance using recent highs to recent lows to calculate how for a bounce may go…)
Note that the following MarketSmith charts are built with Investors Business Daily’s product suite.
I am an Investors Business Daily (IBD) partner and promote the use of their products. The entire platform offers a good mix of analysts, education, and technical and fundamental data.
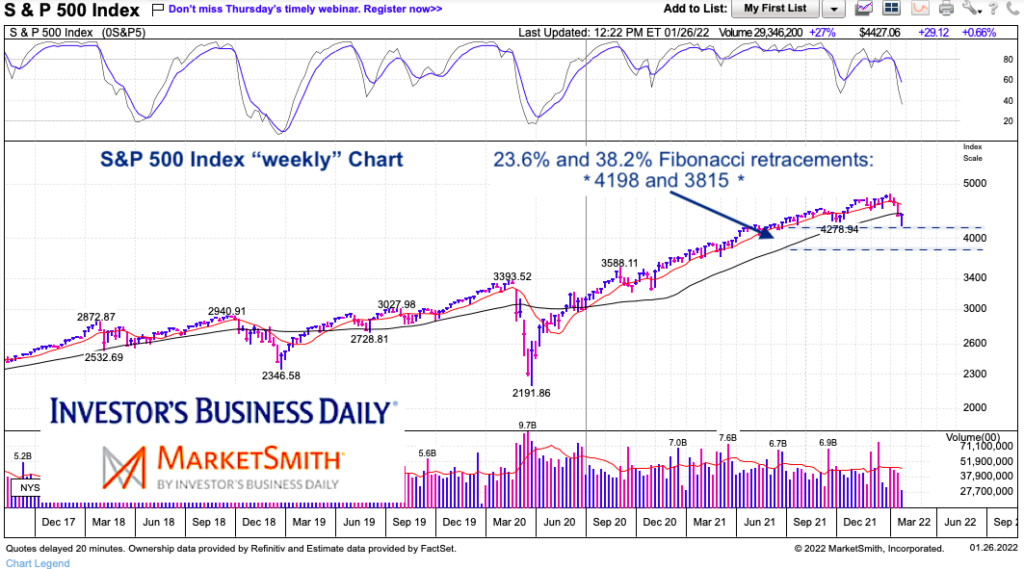
S&P 500 Chart with Fibonacci Levels
The S&P 500 touched down as low as 4222 on Monday, so we can call that a test of the 23.6% Fibonacci retracement. Perhaps from here we bounce. But should that low break, then I’d eye the 38.2% Fibonacci at 3815 as the next potential test (and area I’d add longs into).
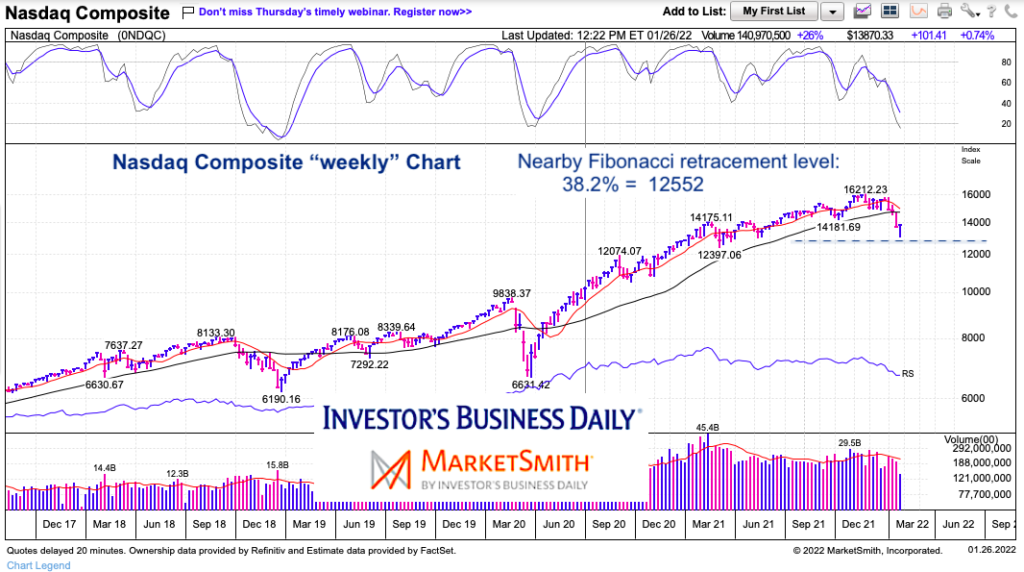
Nasdaq Composite Chart with Fibonacci Levels
Similar look on the Nasdaq Composite. It came down toward the 38.2% Fibonacci level but ultimately did not test it. Monday’s low was 13094. Again, markets are looking for a bounce here… but if Monday’s low is broken, look for 12552 Fibonacci level to be tested. And if broken, note that the 50% retracement is at 11422.
Twitter: @andrewnyquist
The author has a trading position in mentioned securities or similar at the time of publication (long SPY and QQQ). Any opinions expressed herein are solely those of the author, and do not in any way represent the views or opinions of any other person or entity.

: Showing Some Signs of Emerging Strength")
