The hope that the stock market held onto coming into the week waned a bit on Monday as government stimulus talks stalled once again.
After the market close, more news headlines emerged as the Senate is back and both sides know that politically some stimulus package should be passed.
And that is the question: Who gains or loses on a package passing?
Republicans behind in the polls do not want to appear uncooperative. Yet the Dems, should they compromise, will look weak, hence bolstering the Republicans coming to the table.
With this sort of political footballing, what we mere trading mortals have to follow is price.
Unless the stimulus comes through and is perceived as enough, the stock market could be showing possible exhaustion as we are now 15 days away from the election.
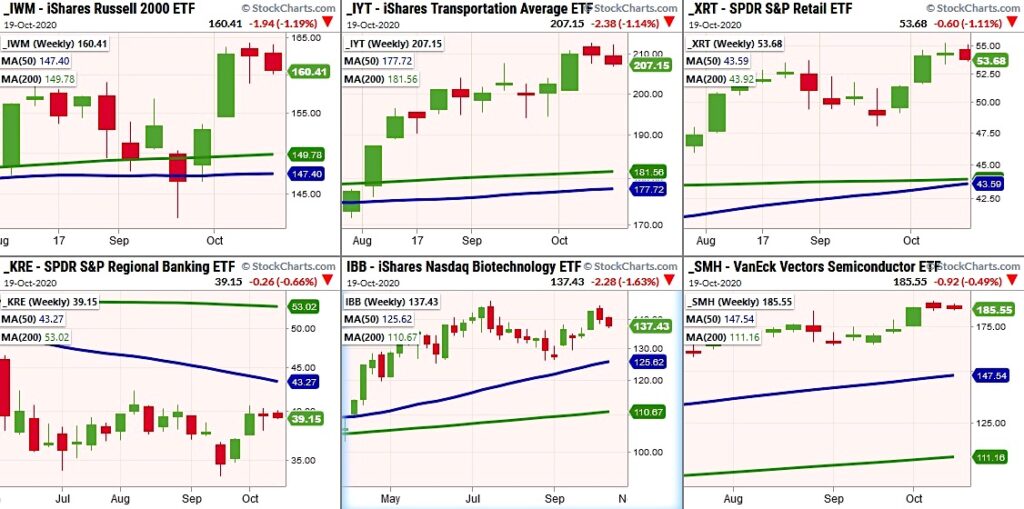
Above are the weekly charts of our favorite core ETFs to follow (our “Economic Modern Family”).
The Russell 2000 ETF (IWM), who has been leading, opened Monday inside the trading range of last week. At this point, price tells us digestion rather than failure.
Could that change?
Absolutely. If IWM fails last week’s lows, we could see a move closer to 155.
The Transportation Sector ETF (IYT), another leader as last week it made new all-time highs, already broke last week’s lows so this has to regain the 208 level or could visit 203.00-204.00 quickly.
As we wrote about over the weekend, the Retail Sector ETF (XRT) actually started the ball rolling on this most recent rally. Consumer spending though is now outpacing consumer income. With the holiday season coming, this could be an issue. Stimulus will help of course. However, other factors will come into play here more than anywhere-particularly, sentiment and confidence. Can consumers remain optimistic?
Technically, XRT is about to enter a weekly bullish phase with a golden cross of the weekly moving averages. Yet, the price of the MAs is way lower. Any bigger correction will have us looking at the support closer to the MAs.
The good news is that at this point, half of the family will be in a bullish weekly trend with IWM and IYT looking to join in soon.
The Regional banks ETF (KRE), also starting out inside last week’s range, continues to hover close to resistance at $41-42. As a laggard, money rotation here would be a healthier sign.
With vaccine issues, the biotechnology sector is either forming a double top pattern, or a right shoulder to an inverted head and shoulders bottom. Either way, that could lead it back to a test of the 50-WMA.
Lastly we have the Semiconductors Sector ETF (SMH), who is currently having an inside week as well. Even after the late selloff, SMH held up and with earnings on tap, is also a clue for whether the market is coming to a head or not.
Just like our head of Bosque beer, the market has foamed up to some lofty levels.
With still more time between the election and stimulus to spare, we could see prices settle lower as the Family sips their ale and waits for the next big piece of news.
S&P 500 (SPY) Looking to test the 50-day moving average at 339
Russell 2000 (IWM) 155 is best underlying price support.
Dow Jones Industrials (DIA) 285 is pivotal price area with 278-280 support
Nasdaq (QQQ) 290 is now price resistance
KRE (Regional Banks) Holding for now. Price resistance is at $40-41
SMH (Semiconductors) 185 to 190 is a good trading range.
IYT (Transportation) Maybe a visit to 200 is in the cards, but over 212 looks great
IBB (Biotechnology) 130 is major price support with pivotal support at 134-135
XRT (Retail) Best news is that it closed above last week’s lows. If it fails, looking at 50.00
Twitter: @marketminute
The author may have a position in the mentioned securities at the time of publication. Any opinions expressed herein are solely those of the author, and do not in any way represent the views or opinions of any other person or entity.

: Showing Some Signs of Emerging Strength")

