S&P 500 Trading Outlook (3-5 Days): Turning Bearish
Expecting a peak on Friday or Monday. Wave structure allows for a max of 2955 on the S&P 500 Index (cash) and 2964 on S&P 500 Futures.
So I think it’s right to sell into gains on Friday.
The S&P 500 Index pattern could peak out Friday or Monday given Elliott wave patterning and market cycles.
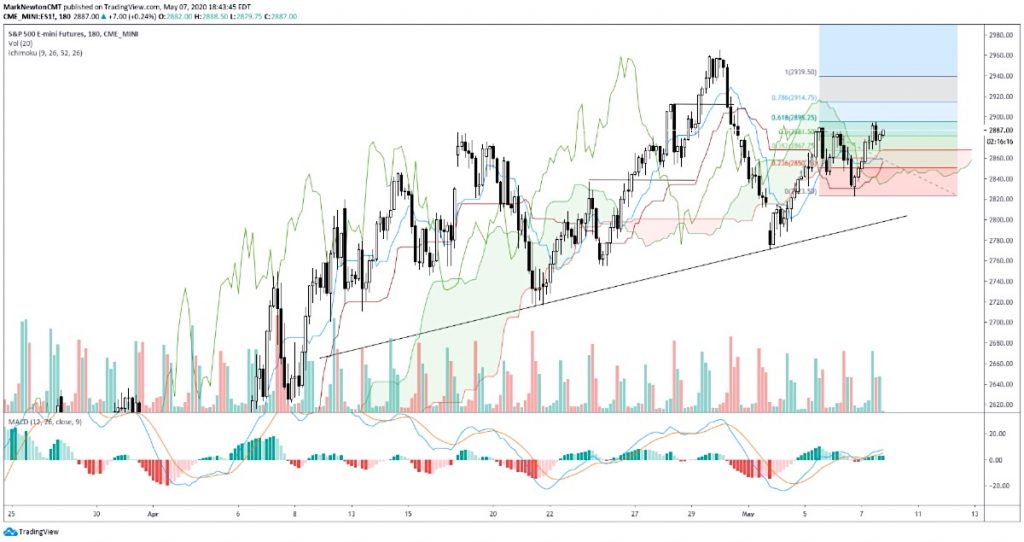
This formation shown above for the S&P 500 has gotten more clear over the last 24 hours and should have minimal upside before turning lower.
This pattern from earlier this week resembles an ABC bounce, with the C wave underway. In plain English, stops are near last week’s 2955 high and one should look to sell into any early Friday gains which then should stall out and reverse back lower. 2848 is the first important area on the downside, and under leads to 2797. Under that would lead quickly down to 2650 area, which one should use to cover shorts.
For now, despite all the focus on Tech, rightly so, the broader pattern doesn’t appear as bullish, and looks right to stay cautious, likely for the next couple weeks.
Key points:
1) This remains a bear market bounce, NOT the start of a new bull market
2) Any stalling out in early/mid-May that backtracks likely will NOT reach new lows right away given the extent of our rally.
Broad Market Overview
Thursday’s lift makes the bearish case pretty attractive given the Elliott pattern and cycles which hit between Friday and next Monday, so it’s right to consider selling into gains, in my opinion, expecting that S&P does not get above last week’s highs at 2955 before turning down to take out 2791, so I’m sticking with my bear case unless 2955 is exceeded, which is less than 2% higher.
A couple interesting developments in that Thursday’s rally WAS a lot more broad-based, but much of this came from Energy, Materials, and Financials which needed it badly. However, breadth is still down from mid-April and late April and shows this push up into May as having been nearly all Technology driven. While there’s nothing wrong with leadership out of the top group within the S&P, to see such flat breadth most of the week while Financials and Industrials are losing ground doesn’t inspire too much confidence. This same type behavior was witnessed into mid-February before markets turned down, outside of leadership from the defensive sectors which largely has not been seen thus far.
One thing to note- Treasury yields turned back down sharply Thursday and are now hovering near key support. TNX cannot afford to break .57 bps without causing some real near-term damage and represent an eerie sense of Deja-Vu to the stock market which peaked out right as yields plunged in mid-February. While the Treasury supply is well known, for now, charts in TNX don’t look too bullish, and are looking increasingly vulnerable to a breakdown. So this is a key catalyst to watch, along with a break in some of the leading stocks like AAPL,, MSFT, GOOGL which have been stellar of late and important stocks to watch given their representation.
Some good news comes out of the Metals space, which rallied sharply on Thursday, as Silver showed some evidence of playing catchup- I like the move in GDX, the Gold Miners ETF, and feel that Gold is inching towards its own breakout, which would have more conviction if this can hold and extend on Friday for a weekly close, rather than just daily. For now, this is a key focus area for longs, and i’ve added a few metals plays to the long list.
Overall, Bradley cycles suggest a peak as of 5/9 which could come on Friday or Monday, and are being taken seriously given the breadth dropoff.. However, this is countered with evidence that Sentiment is actually getting more bearish of late, which is precisely what the Bears don’t want to hear. Uncertainty can sometimes lead to panic, but it rarely leads to pullbacks that have much longevity. Therefore, while there is an above-average chance of stock indices slipping into late May, it’s doubtful , in my view, that 2645 will be taken out, and this should prove to be a buyable pullback. The next 12-18 trading hours should clarify things one way or another. Stay tuned.
If you have an interest in seeing timely intra-day market updates on my private twitter feed, please follow @NewtonAdvisors. Also, feel free to send me an email at info@newtonadvisor.com regarding how my Technical work can add alpha to your portfolio management process.
Twitter: @MarkNewtonCMT
Author has positions in mentioned securities at the time of publication. Any opinions expressed herein are solely those of the author, and do not in any way represent the views or opinions of any other person or entity.


