Small cap stocks spent several months charging higher out of the 2020 coronavirus crash lows.
BUT they have also spent the past several months forming a reversal pattern that is beginning to look like a “U-Turn”.
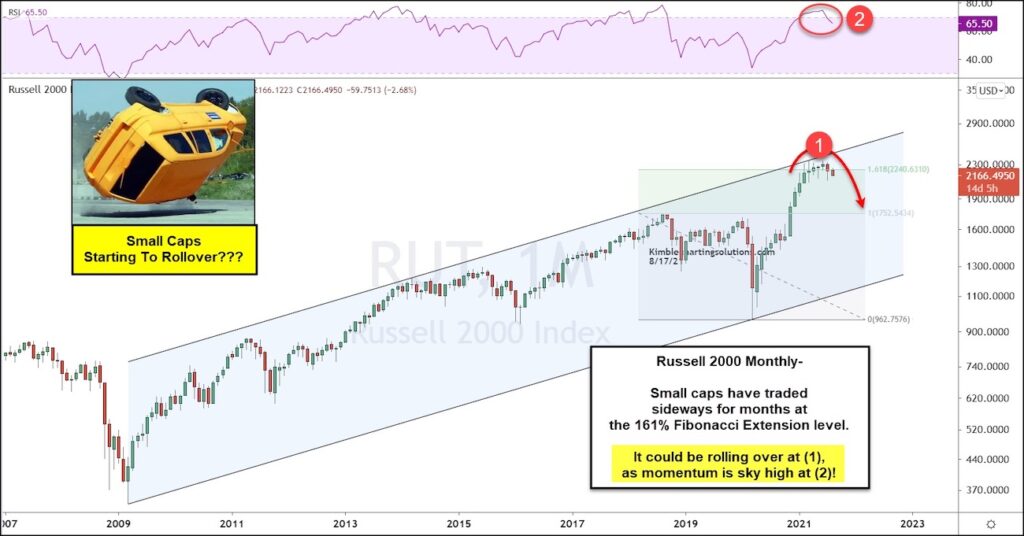
Today’s chart looks at the Russell 2000 small cap index on a long-term “monthly” basis.
As you can see, the Russell 2000 has traded in a broad rising price channel since 2009. This year, the index rubbed up against the upper end of the channel before trading sideways for months at (1). The upside was also limited by another key level – the 161% Fibonacci extension level. AND at the same time momentum was sky high at (2).
Now it appears that the small cap Russell 2000 Index could be rolling over. Will this key Fibonacci level and momentum peak mark a top for small caps? Stay tuned!
Russell 2000 “monthly” Chart
Note that KimbleCharting is offering a 2 week Free trial to See It Market readers. Just send me an email to services@kimblechartingsolutions.com for details to get set up.
Twitter: @KimbleCharting
Any opinions expressed herein are solely those of the author, and do not in any way represent the views or opinions of any other person or entity.
: Cup (and Maybe Handle) Watch")
 Trading Near Top Of Price Range")
 Reaches Important Price Support")
: Cup (and Maybe Handle) Watch")