As the year nears its end, we have a lot of ideas to keep watch of.
Tuesday’s price action could be the late Santa rally people were hoping for.
Though it’s better late than never, we should watch for the major indices to hold up through Thursday since the trading week is going to be cut short with the Market closing Friday.
With that said, let’s look at some ideas that are setting up this week and into the coming year.
One space to look at is crypto which is currently showing consolidative price action within the large-cap coins, like Ethereum and Bitcoin.
However, if cryptocurrencies begin to rally, we can watch for Hut 8 Mining (HUT) to do the same as it’s a large holder of self-mined bitcoin.
Currently, HUT has come back through the 200-Day moving average at $7.63. If it can hold over this price level, we can look for a quick rally from the lows.
Another interesting pick is Coty (COTY) which focuses on consumer beauty products. COTY is interesting not only from its daily break over the 10-DMA, but for its recent bullish phase change, and potential long-term trend change on the weekly chart.
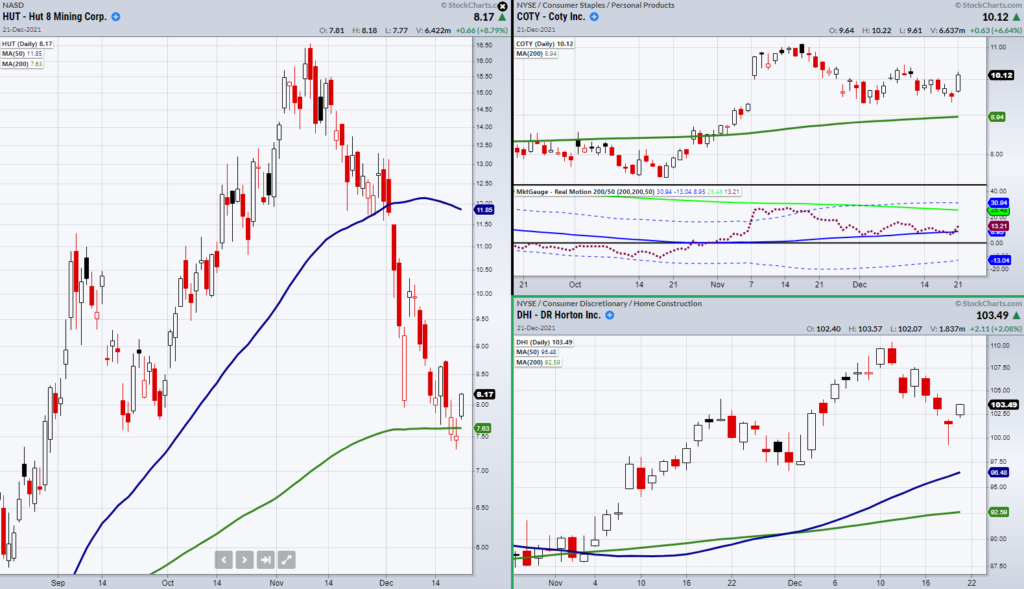
If COTY can hold its 200-Week Moving average as seen in the above chart, it shows that it’s setting up on multiple time frames.
Additionally, using our proprietary Real Motion indicator COTY is holding over its 50-DMA on momentum as well.
On a daily timeframe, D.R Horton (DHI) has also made a recent bullish phase change and a quick reversal from Monday’s low.
The Homebuilding and Mortgage company has the potential to increase production as homebuilding prices begin to normalize in 2022 which makes this a long-term play if it continues through highs.
With that said, we need to remember that price action in the market is currently more volatile and though Tuesday was a large green day for the major indices, we must be careful of overhead resistance.
Stock Market ETFs Trading Analysis & Summary:
S&P 500 (SPY) 470 resistance area.
Russell 2000 (IWM) 224 resistance.
Dow (DIA) 360 resistance.
Nasdaq (QQQ) Watching for second close over the 50-DMA at 387.99.
KRE (Regional Banks) Watching for 67.25 as new support.
SMH (Semiconductors) 288.14 new support.
IYT (Transportation) 258.53 new support.
IBB (Biotechnology) Needs to clear 155.
XRT (Retail) 83.54 new support.
Twitter: @marketminute
The author may have a position in mentioned securities at the time of publication. Any opinions expressed herein are solely those of the author and do not represent the views or opinions of any other person or entity.

: Worrisome to Broader Market?")


