While we follow the Fed announcement tomorrow, we’ll closely watch Grandpa Russell’s (IWM) reaction.
As the patriarch in charge of Mish’s Modern Family, Grandpa Russell’s pricing is meticulously monitored daily and weekly. IWM is also the biggest ETF in the small-cap category, with around $56 billion in assets.
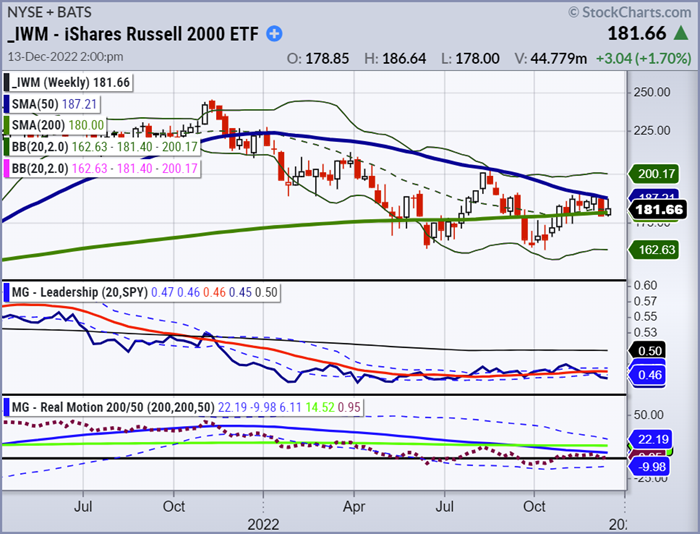
IWM’s last few weeks have been characterized by price consolidation and failed attempts to make any meaningful new highs.
IWM is trading significantly weaker than the S&P 500 and is showing substantially less strength.
Our Triple Play Leadership Indicator shows a need for more market leadership if IWM is going to break out.
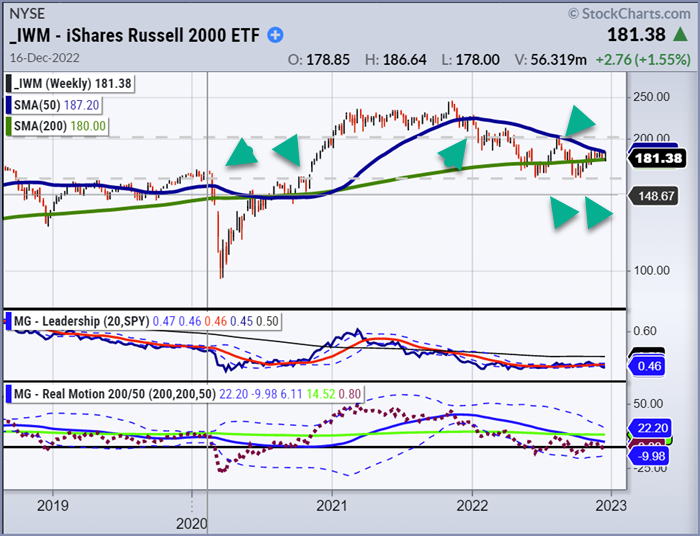
Looking at the weekly chart of IWM, it is barely trading above its 200-week moving average and potentially in danger of crossing below it.
The weekly chart also looks like a potential head and shoulders, a trend reversal pattern.
IWM could break the 200-week moving average and trend down further until the right shoulder is broken if this pattern is validated in the coming weeks.
The head and shoulders pattern would take IWM to a price in line with strong support and near pre-COVID price levels. IWM found support twice earlier this year around this area of support at 162.
Grandpa Russell is widely diversified across many sectors and represents nearly 2,000 small-cap equities, so having IWM participate in any market rise is essential for long-lasting rallies.
Our proprietary Real Motion Indicator above shows that IWM’s downward momentum aligns with the current price action. In other words, additional price drops may be in store.
\So, what does this ultimately imply for investors?
The takeaway is that IWM should be watched closely in the coming days, especially IWM’s weekly closing price.
Although the index has the potential to reach new highs, momentum and other proprietary indicators are warning that patience is warranted.
We are waiting for a solid breakout, but the price is breaking down on the weekly chart according to our proprietary Triple Play Leadership Indicator and our Real Motion Indicator.
To better understand where IWM is going, keep a close eye on the Triple Play Leadership Indicator and our Real Motion Indicator.
Pay attention to these indicators to stay on top of the market every trading day.
Stock Market ETFs Trading Analysis & Summary:
S&P 500 (SPY) 397 first level of support and 404 first level of resistance. The 50-week MA looms above as overhead resistance 410. Until that clears, this could return to support at the 50-DMA or 380.
Russell 2000 (IWM) 177 key support and 183 first level of resistance. Similarly, 190 is resistance and now looking at 177 as support and must hold.
Dow Jones Industrials (DIA) 337 first level of support and 344 resistance. As the only index above the 50-WMA, support at 329 is key.
Nasdaq (QQQ) 284 first key level of support and 292 resistance. Still the weakest index. Hovering on major support at 278 or trouble ahead.
KRE (Regional Banks) 57 key support and 63 resistance. After weeks of sideways action, last major support is at 57.00
SMH (Semiconductors) 223 support and 229-230 heavy resistance. If SMH can lead, then 230 is the place to clear and take notice.
IYT (Transportation) 222 key support and 228 resistance. Another one to fail the 50-WMA.
IBB (Biotechnology) 133 first level of support and 137 key resistance. This has been the year of do not chase breakouts. Like DIA above the 50-WMA and will see if can hold 127 key support or break out above 137 significant overhead resistance.
XRT (Retail) 63 first level of support and 67 resistance. Never got the clearance over 67.00 so now we watch 63 and 60 as strong support.
Twitter: @marketminute
The author may have a position in mentioned securities at the time of publication. Any opinions expressed herein are solely those of the author and do not represent the views or opinions of any other person or entity.


 and Semiconductors (SMH): Concerning Price Pattern?")


