The past few weeks have seen the continuation of the bull market trend for the S&P 500 Index and Dow Jones Industrial Average.
That isn’t to say that the other two major stock market indices, the Nasdaq 100 and Russell 2000 haven’t played along. They have… they’ve just lagged or diverged.
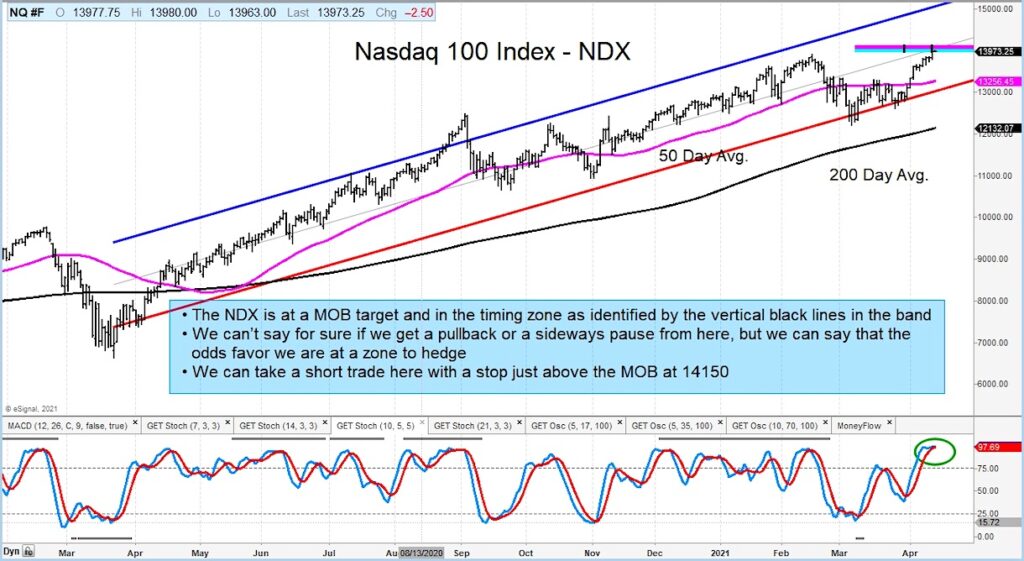
In the case of the Russell 2000, it’s simply lagged. In the case of the Nasdaq 100, it’s diverged… it’s trading under it’s all-time highs while the S&P 500 Index and Dow Jones Industrial Average are trading at all-time highs.
As well, the Nasdaq 100 Index is trading into a MOB price target band and the mid-point of its regression trend channel as a resistance area. We can see skilled traders taking a short position here with a stop just above the MOB band at 14150. If that isn’t your game then simply wait to add long exposure until we see if the index can breakout from here.
The author or his firm may have a position in mentioned securities at the time of publication. Any opinions expressed herein are solely those of the author, and do not in any way represent the views or opinions of any other person or entity.

: Showing Some Signs of Emerging Strength")

