For much of the past 2 years, the Russell 2000 Index has been lagging the broader market. And when combining this theme with the coronavirus pandemic, investors all but wrote off small cap stocks…
But that could be changing.
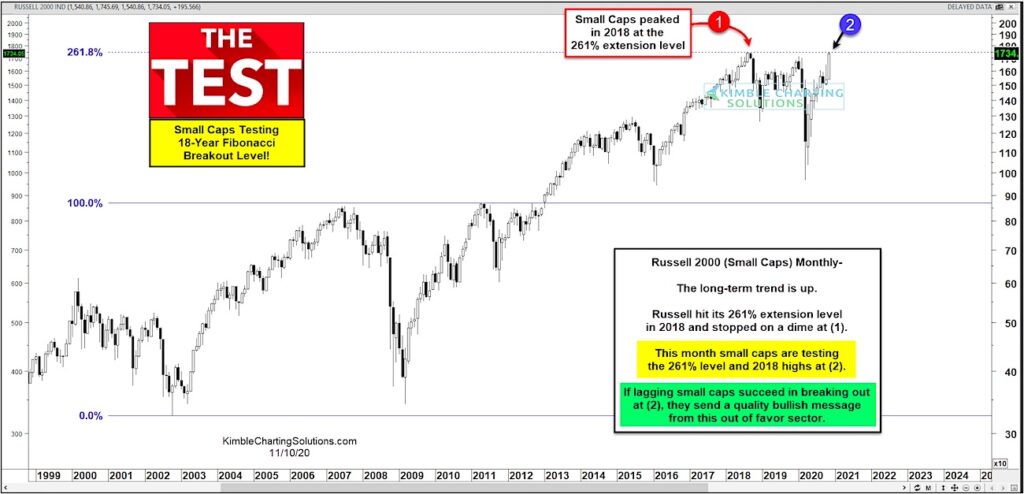
Despite the underperformance, the small cap Russell 2000 Index is in a long term up-trend marked by higher lows and higher highs.
Today’s chart highlights this long term trend and why investors need to pay attention to the Russell 2000 Index right now. Note that the highs from 2018 at (1) mark an important price resistance level – it is the 261% fibonacci extension level. And we are testing this level once again at (2).
A breakout to new all-time highs would be bullish for both the Russell 2000 Index and the broader market, as investors love to see small caps out-perform (as it’s a good sign for the economy). So this is a big test for small caps! Stay tuned!
Note that KimbleCharting is offering a 2 week Free trial to See It Market readers. Just send me an email to services@kimblechartingsolutions.com for details to get set up.
Twitter: @KimbleCharting
Any opinions expressed herein are solely those of the author, and do not in any way represent the views or opinions of any other person or entity.


