Precious metals prices have been creeping higher with Gold trading over $2000/oz.
A weaker US Dollar has provided a nice tailwind and Gold bugs celebrated a new monthly closing high last week… So, is it time for Gold to finally breakout to new all-time highs?
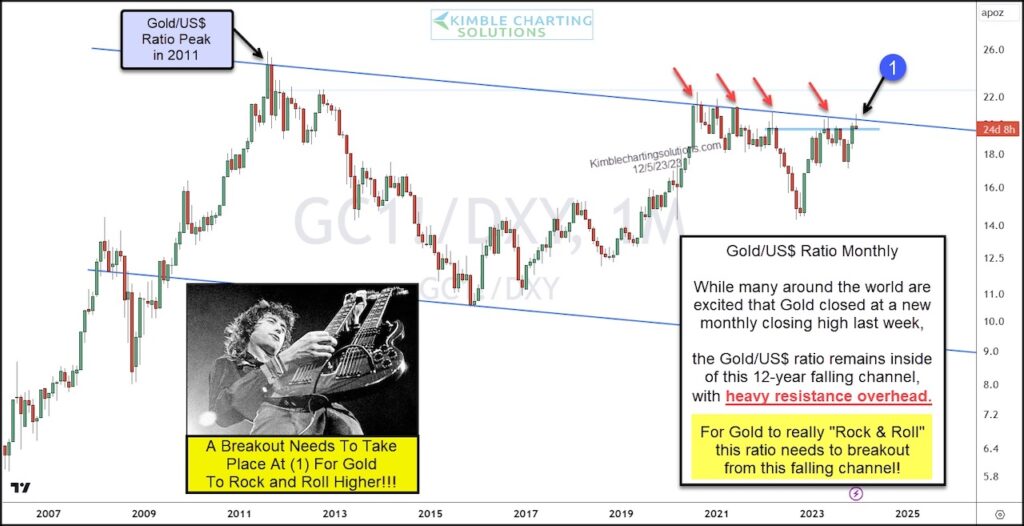
Well, today’s “monthly” chart of the Gold to U.S. Dollar ratio highlights one more major hurdle.
As you can see, the ratio remains inside of a long-term falling channel. And the overhead resistance (see red arrows) is very heavy.
the Gold/U.S. Dollar ratio is once again (the 5th time!) testing this falling channel resistance at (1).
In my humble opinion, this ratio needs to see a breakout for Gold to really rock and roll to the upside. Stay tuned!
Gold to U.S. Dollar Index Ratio “monthly” Chart
Note that KimbleCharting is offering a 2 week Free trial to See It Market readers. Just send me an email to services@kimblechartingsolutions.com for details to get set up.
Twitter: @KimbleCharting
Any opinions expressed herein are solely those of the author, and do not in any way represent the views or opinions of any other person or entity.

: Worrisome to Broader Market?")


