Gold’s long drawn out sideways-to-lower consolidation recently gave way to a selloff.
Blame it on rising bond yields / interest rates, blame it on the bitcoin love affair, or blame it on investors excitement about re-opening the economy this spring.
Whatever. It all shows up in the price action. Follow price and develop your investing/trading plan around the price action and you’ll be okay. Price speaks to us.
So what is gold saying right now? Is the selloff almost over? In the chart below, we highlight key price “guide-posts) to watch in the days/weeks ahead.
Note that the following MarketSmith charts are built with Investors Business Daily’s product suite.
I am an Investors Business Daily (IBD) partner and promote the use of their products. The entire platform offers a good mix of technical and fundamental data and education.
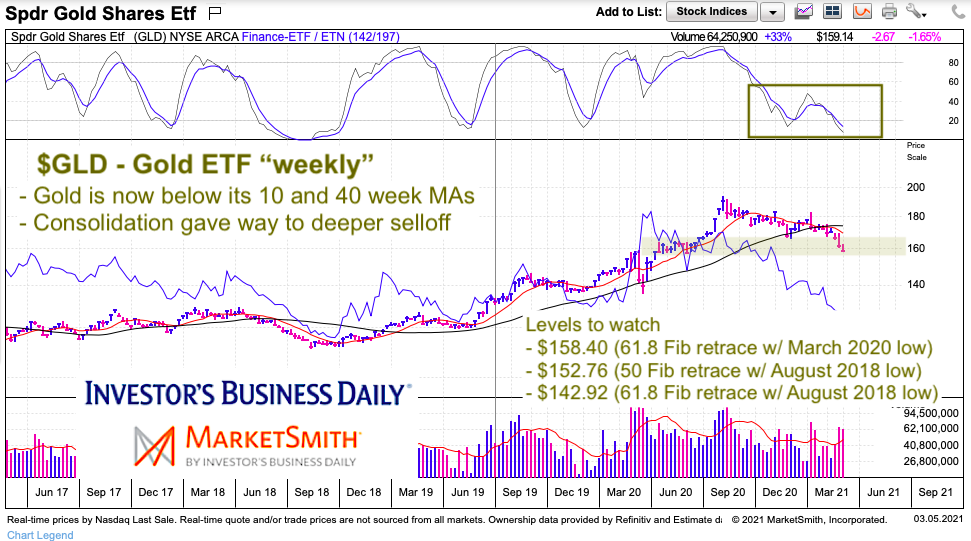
$GLD – Gold ETF “weekly” Price Chart
The past month has seen gold decline through its 10 and 40 week moving averages. And momentum has fallen to new 2 year lows. So all is not well in precious metals land.
What price support levels should we be watching?
Well, right now the gold ETF $GLD is testing a key band of lateral price support as well as its short-term Fibonacci retracement level (158.40). If gold doesn’t bounce right here, right now then we might be looking at a decline to longer-term Fibonacci retracement levels at 152.76 (50% Fib using August 2018 lows) or $142.92 (61.8% Fib using August 2018 lows).
In sum, if gold doesn’t firm up right now, it could fall another 3 to 10 percent. Stay tuned.
Twitter: @andrewnyquist
The author may have a position in mentioned securities at the time of publication. Any opinions expressed herein are solely those of the author, and do not in any way represent the views or opinions of any other person or entity.

: Showing Some Signs of Emerging Strength")
