2022 has gotten off to a rocky start. Stocks are down, inflation is up, and interest rates are on the rise to try to calm inflation.
But the economy is stagnating… and perhaps heading into a recession. And the war abroad isn’t helping, with several key goods at risk (and economic sanctions slowing trade).
Today, we look at a sector that often provides a glimpse of trouble ahead – the Financial Sector ETF (XLF). Is it forming a massive top or just trading in a range? The outcome will be important.
Note that the following MarketSmith charts are built with Investors Business Daily’s product suite.
I am an Investors Business Daily (IBD) partner and promote the use of their products. The entire platform offers a good mix of analysts, education, and technical and fundamental data.
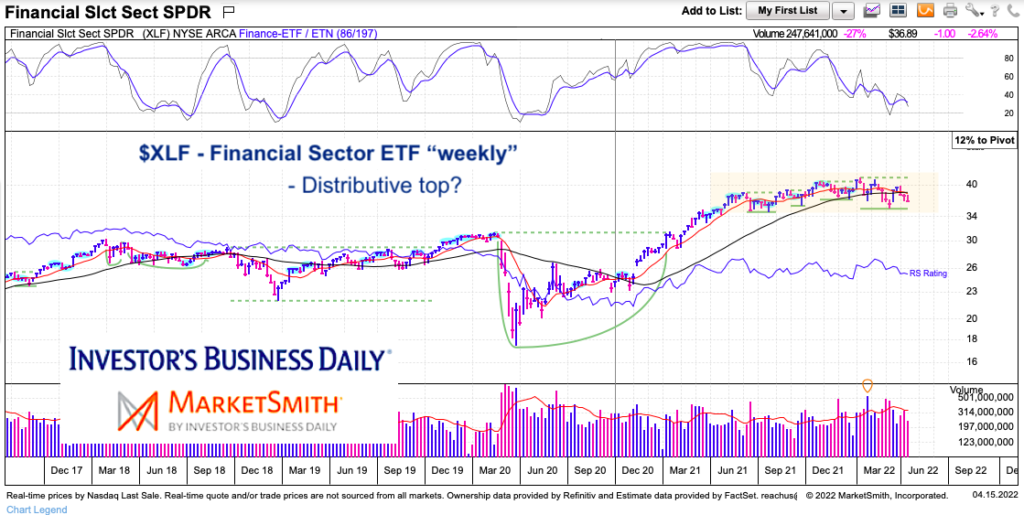
$XLF Financial Sector ETF “weekly” Chart
Here we can see the wide trading range over the past year (approx $34 to $40). Lagging momentum and strength point to the potential of a distributive top (similar to what we see on the Russell 2000 chart). A couple of weekly closes below $34 would underscore the fugly economic data we are seeing.
Twitter: @andrewnyquist
The author may have a position in mentioned securities at the time of publication. Any opinions expressed herein are solely those of the author, and do not in any way represent the views or opinions of any other person or entity.


