It’s fair to say that inflation has been one of the key economic buzz words of 2022 (along with interest rates).
Will the Federal Reserve’s last two big rate hikes help? Will the latest government inflation bill matter? Perhaps. But one key ingredient may have peaked a couple months back: Commodities.
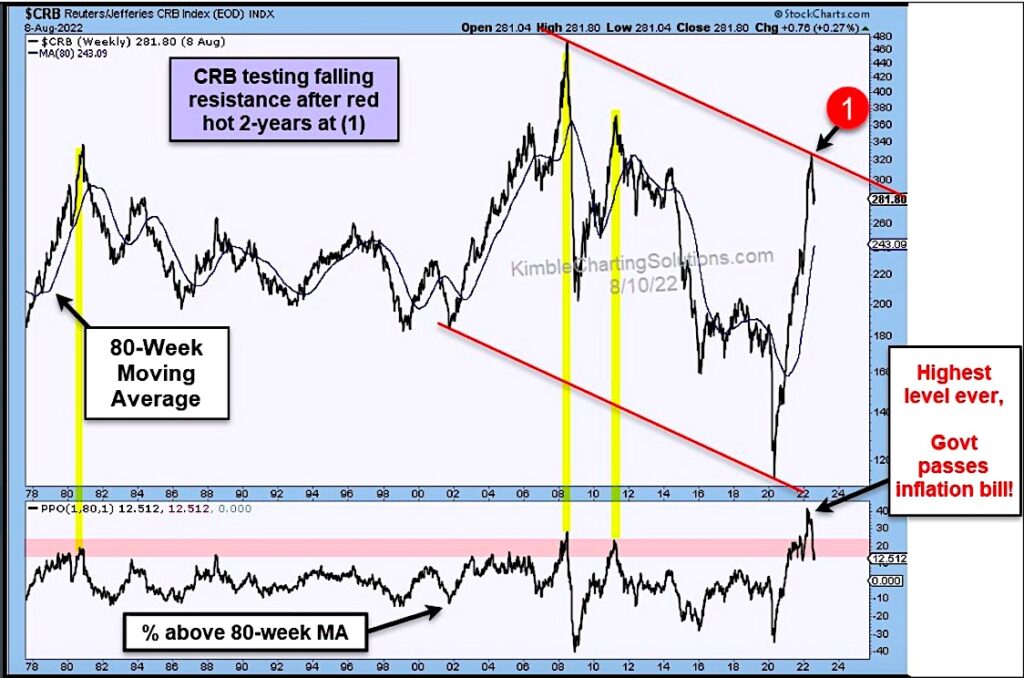
Today we look at a long-term chart the CRB Commodity Index. As you can see, commodities had a very bullish 2-year run higher.
However, price tested falling resistance at (1) in June and reversed lower. That peak also coincided with its highest ever momentum reading (using percent above the 80-week moving average). Previous momentum peaks resulted in big declines in the CRB Index.
Consumers are hoping this momentum peak also produces a fall in commodity prices. Stay tuned!
CRB Commodity Index Long-Term Chart
Note that KimbleCharting is offering a 2 week Free trial to See It Market readers. Just send me an email to services@kimblechartingsolutions.com for details to get set up.
Twitter: @KimbleCharting
Any opinions expressed herein are solely those of the author, and do not in any way represent the views or opinions of any other person or entity.


