Short answer – probably not, but respite ahead in the short run.
Since spiking on October 9, 2015, the chart for Crude Oil prices has been on a significant move downward, crashing through key support regions. And after failing to recapture the 50 daily moving average after losing it again November 5 or so, it’s been like a ride down Thunder Road (those of you from the South should know this coaster well).
I’ve gotten a few questions on the twitter stream @AnneMarieTrades over the last week asking where Oil prices going to bottom, or at least arrest this cascade, and this seems like a good time to comment on the chart.
Ok, so everyone knows I am a technician. But analysis that is purely technical is as deficient as analysis that is purely fundamental in today’s market. But this is a largely fundamental picture. Supply and demand run the show; and the powers that manage supply clearly have a goal in mind.
That said, I remain fundamentally bearish on oil for a while longer, as I have been for many months (see twitter stream, Benzinga financial media spots in the stream, social media – I blab about that at least bi-weekly).
Let’s have a look at the chart, then comment further on the price action.
Crude Oil Prices (Futures) Chart
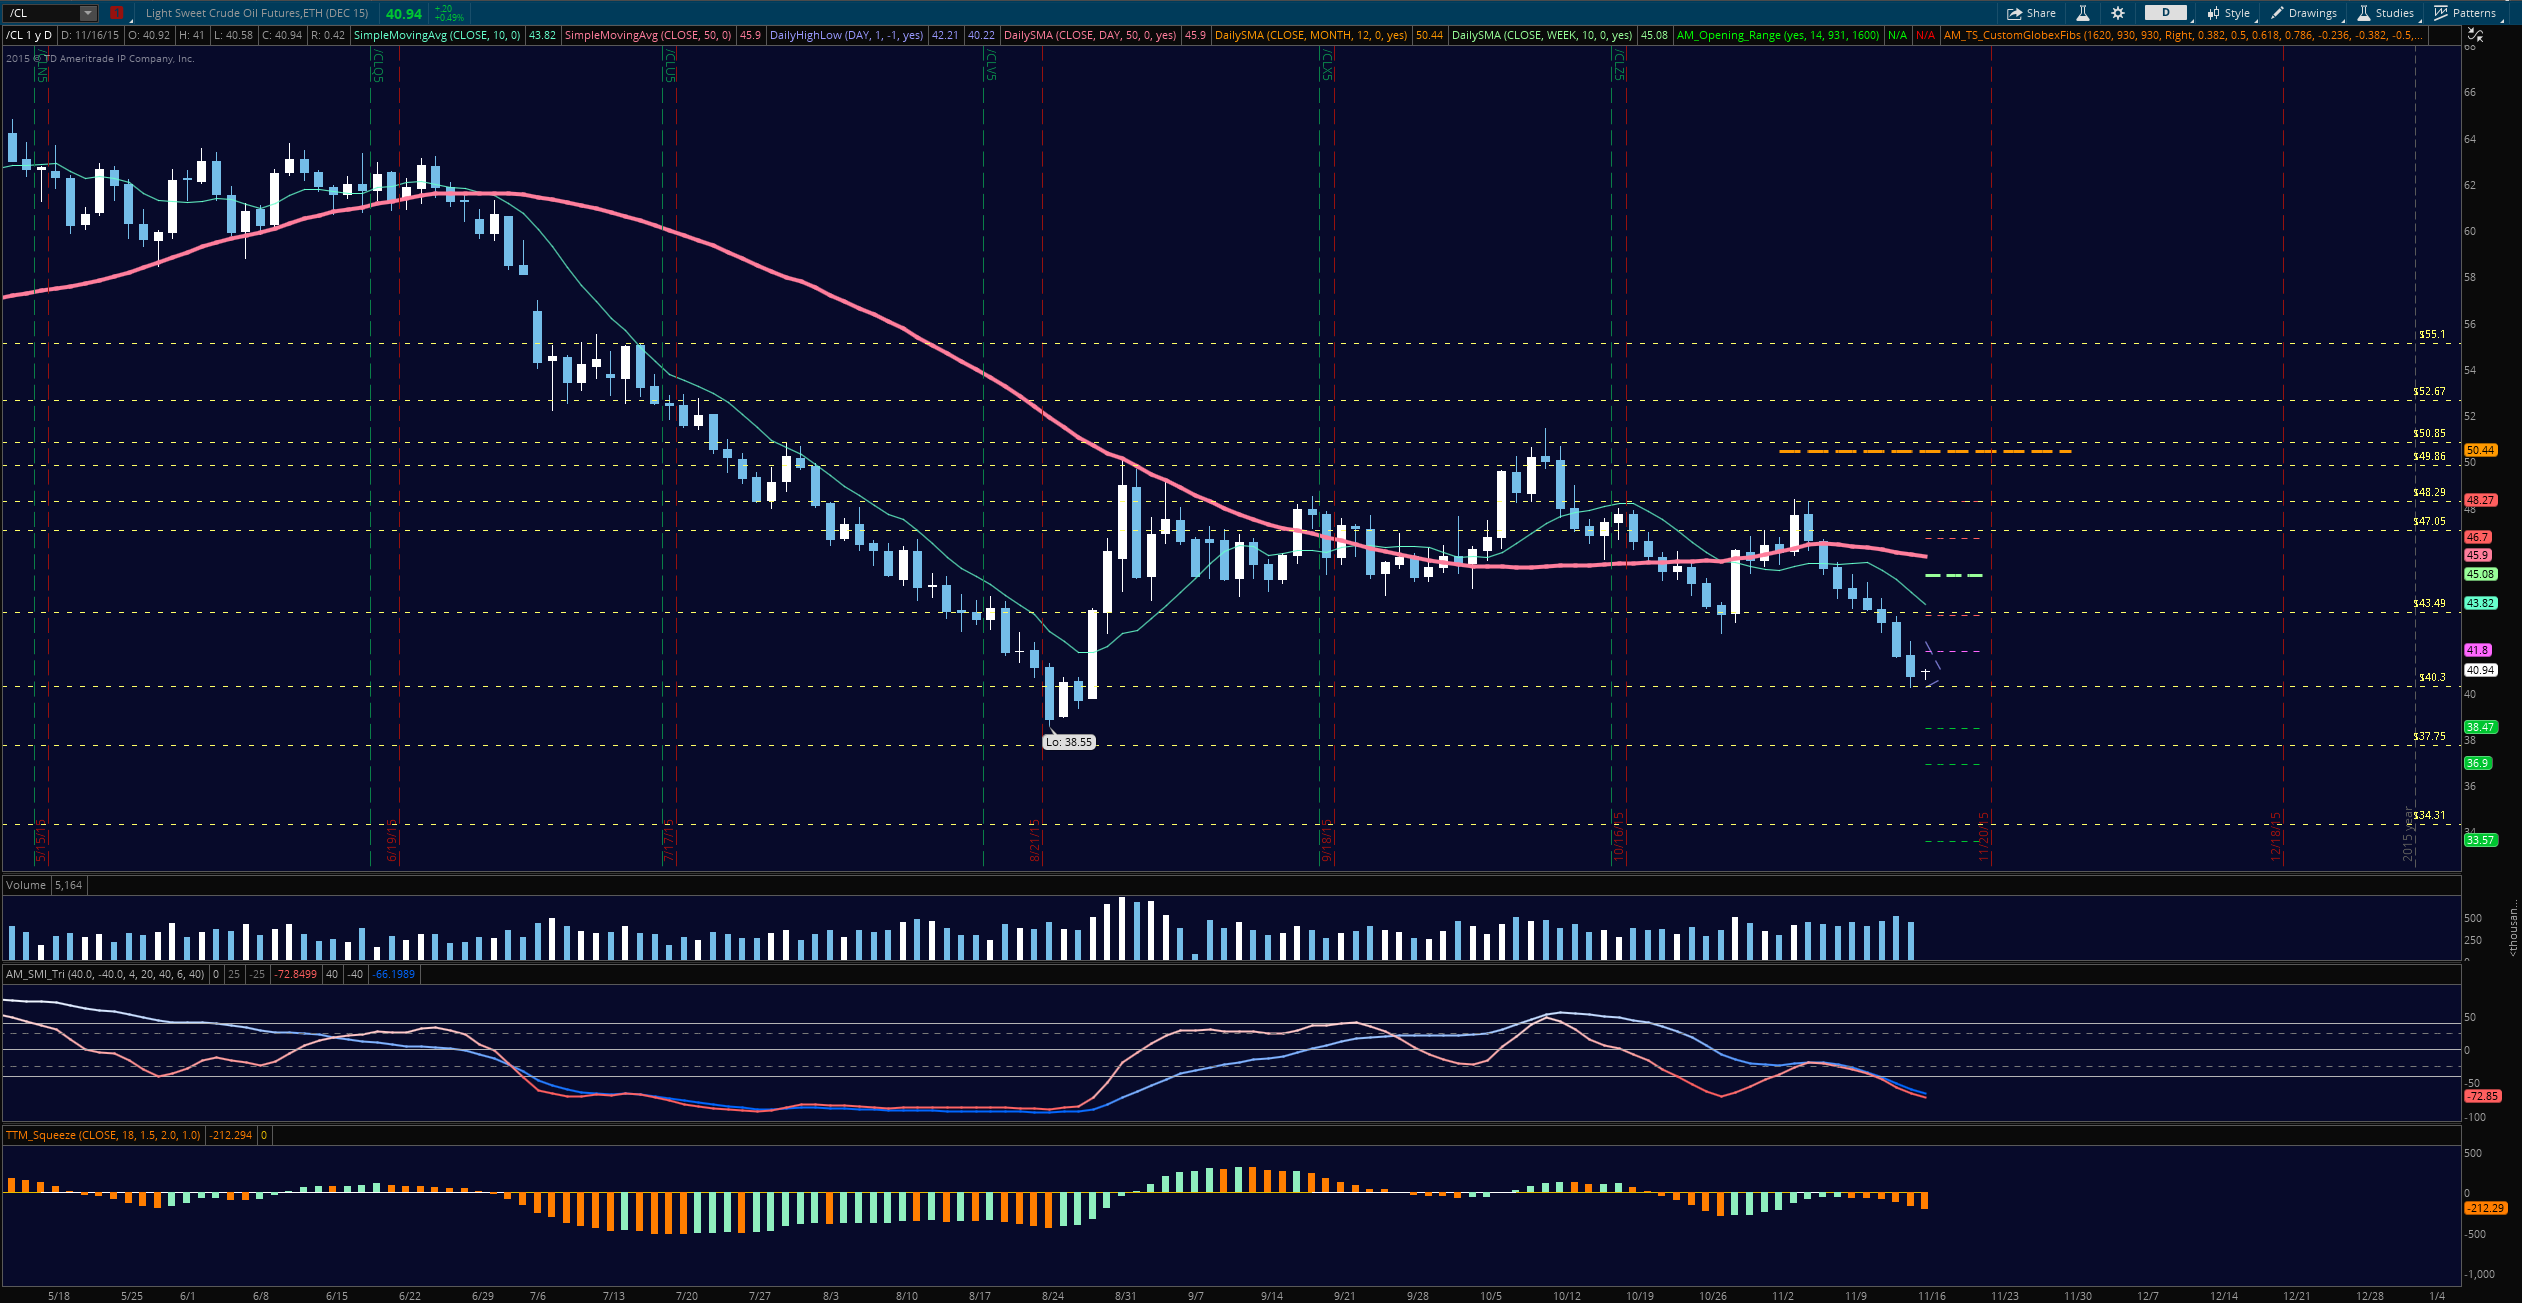
For the chart to properly recover, a number of things need to happen – fundamentally, most importantly, we have to begin to see a drawdown in oil reserves consistently, rather than builds week after week. There is a global slowdown; we know the Saudis are running the game of capturing market share; we know that rigs are still shutting down here as companies try to streamline to bring it up at a cheaper price. Companies over here are consolidating – the ones with deep pockets are acquiring failing ones, and the shake-up in the oil drilling and exploration space is going to affect the landscape for a while.
Trouble is that oil traders are notoriously impatient, and have been expecting a bottom in oil prices (after all, the whole world runs on this energy source – I mean, c’mon, it’s oil) – and afraid that they will miss it. This causes bouts of premature buying which lead to the eventual sell offs. The last example of this was the swift bounce that began on August 24, 2015, and ended on October 9, 2015.
Now, the chart is bouncing off a support zone near 40 and resistance zone that might well run all the way back up to 43.5 or so – even higher. To be sure, th spike in crude oil prices will not hold. There are too many buyers still trapped in long positions.
Knowing this, we can look at the oil chart in terms of perspective – longer term, versus intraday/very short cycle events to determine trading strategy.
If you’re longer term trader, you could certainly try to begin accumulation here at the bounce zone near 40.50, but below 40 suggests at least another 1.50 to the south and potentially a run into 36.90 and even 34.30. You’d be trading in the opposite direction of trend and be in the space of the falling knife. Just pay attention to support, or you’re liable to get a Holm styled roundhouse kick in that trade. Start small sized and be prepared to cut and run. Live to trade another day, instead of sitting upside down in a trade. You could easily turn around and run with the pack if it reverses.
If you’re a short term or intraday trader, you can certainly try to trade the cycle long, up into resistance using your favorite time frame. This is fraught with peril if you don’t pay attention to support and resistance properly. Truth be known, this is my favorite way to trade – intraday. I don’t keep long term positions in oil. I already have a tough time sleeping and that would virtually eliminate my ability to get restful sleep.
The most simplistic way to trade oil, and the most effective, I might add – is to pick your time frame and move in the direction of the moving average you like to watch, making sure your entries are at the failure of resistance if going short, or at the bounce off support if going long. Crazy simple – but it works.
Thanks for reading and have a great day.
Twitter: @AnneMarieTrades
The author does not have a position in any mentioned securities at the time of publication. Any opinions expressed herein are solely those of the author, and do not in any way represent the views or opinions of any other person or entity.


