Over the past several months, growth stocks have begun to fall behind value stocks. And this theme can easily be seen in the growth oriented Nasdaq Composite.
Technology stocks have been a market leader for much of the past two decades. But this trend/theme appears to be coming to an inflection point.
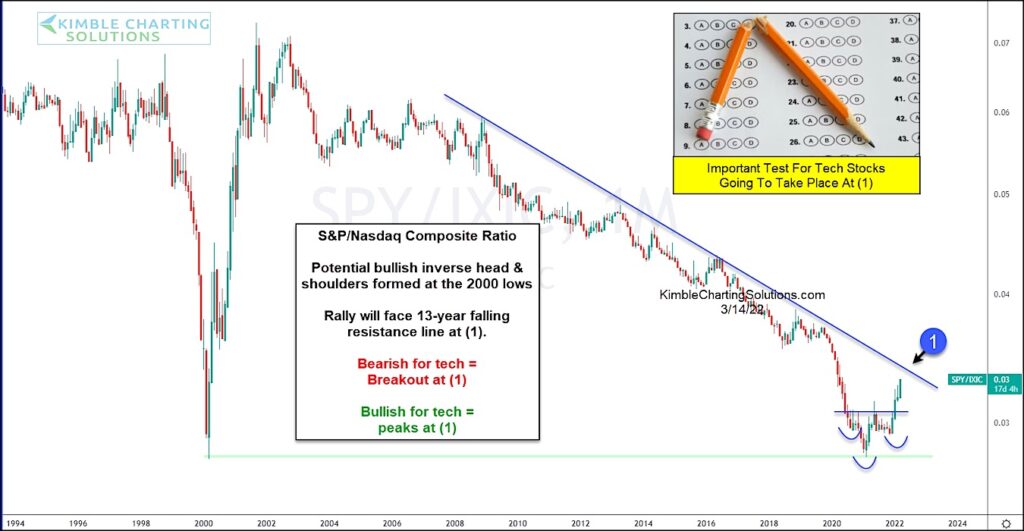
And this backdrop brings us to today’s chart, which highlights the S&P 500 Index versus the Nasdaq Composite via performance ratio. And with tech being a long-term leader, you can see that the broad S&P 500 index has been lagging the Nasdaq over the past several years – see downward trend marked by (1).
BUT, as we mentioned above, tech stocks have been lagging over the past several months. And we can see how the broad S&P 500 Index has been out-performing the tech dominated Nasdaq Composite of late. In fact, it appears to have formed an inverse head and shoulders pattern while rallying up to the trend resistance line at (1).
Looks like a big test for tech is coming up… if resistance holds, it’s great for tech. If not, rut ruh! Stay tuned!!
S&P 500 / Nasdaq Composite Performance Ratio Chart
Note that KimbleCharting is offering a 2 week Free trial to See It Market readers. Just send me an email to services@kimblechartingsolutions.com for details to get set up.
Twitter: @KimbleCharting
Any opinions expressed herein are solely those of the author, and do not in any way represent the views or opinions of any other person or entity.


: Showing Some Signs of Emerging Strength")
