In trading, all that matters is price. And I tend to look use it to identify patterns that can help investors and traders.
We can also use market ratios as a gauge of the stock market’s health.
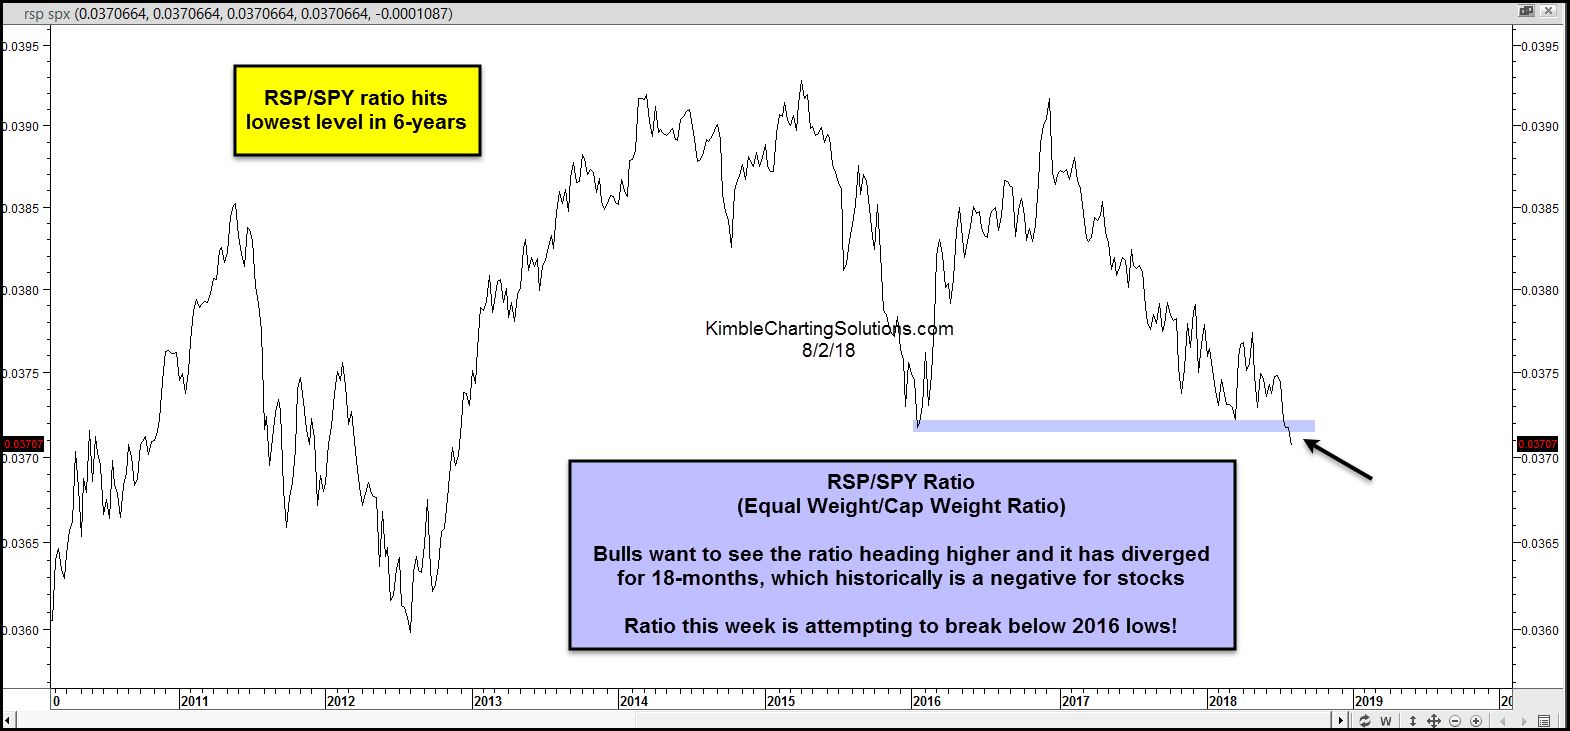
Today, we’ll look at the Invesco S&P 500 Equal Weight ETF $RSP vs the S&P 500 Cap Weighted $SPY.
In short, bulls want to see the ratio heading higher. This is not the case in the chart below.
We can see that the average stock (equal weight) is underperforming. This divergence has historically been a negative for stocks. Note the lack of a new ratio high in January when $SPY was making new highs.
This week, the ratio is attempting to break below its 2016 lows (and in the process making a 6 year low). Keep an eye on this ratio, it could forbode another turn lower.
S&P 500 Equal Weight vs Cap-Weight Ratio
Note that KimbleCharting is offering a 30 day Free trial to See It Market readers. Just send me an email to services@kimblechartingsolutions.com for details to get set up.
Twitter: @KimbleCharting
Any opinions expressed herein are solely those of the author, and do not in any way represent the views or opinions of any other person or entity.


: Showing Some Signs of Emerging Strength")
