The 2022 bear market has seen several stocks fall sharply, especially tech stocks.
And this has made it easy to find “eiffel tower” patterns of late in the tech sector.
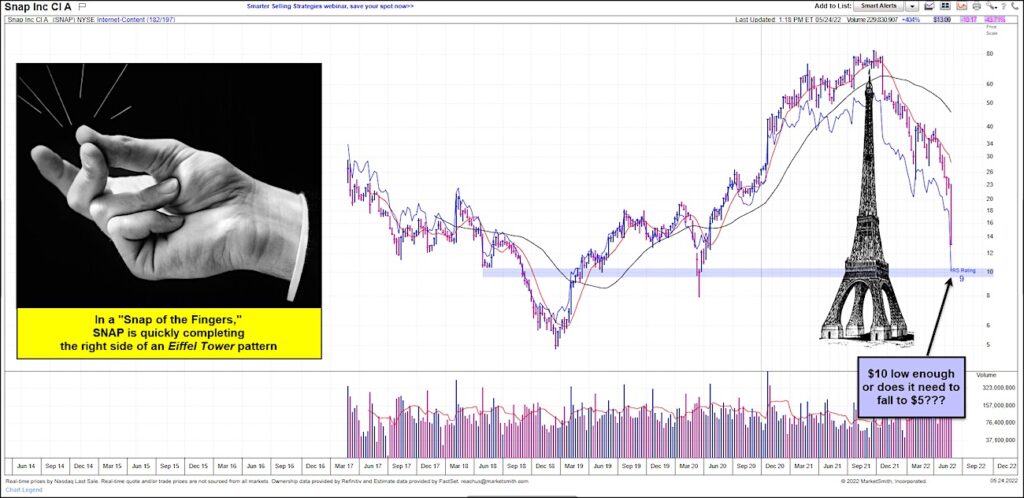
What’s an eiffel tower pattern, you say? Just check out today’s chart of Snap, Inc. (SNAP).
Gains gone in a snap of the fingers
Below is a “weekly” chart of SNAP. As you can see, the stock rose very sharply before declining sharply… forming an eiffel tower pattern.
The question for SNAP now is at what level is the Eiffel tower complete? $10 or $5 price support? Stay tuned!
$SNAP Snap Inc “weekly” Stock Chart
Note that KimbleCharting is offering a 2 week Free trial to See It Market readers. Just send me an email to services@kimblechartingsolutions.com for details to get set up.
Twitter: @KimbleCharting
Any opinions expressed herein are solely those of the author, and do not in any way represent the views or opinions of any other person or entity.
")

 Testing Important Price Support")


")
