With the Fed about to announce its next interest rate change, it’s a good time to check out the condition of gold (GLD).
After all, gold is a tried-and-true safe haven asset and has historically been used as a hedge during times of uncertainty to protect against inflation and stock market volatility.
Gold is also sensitive to interest rates and the trend in the U.S. dollar.
When analyzing the trend or a trade in gold (GLD), it’s a good idea to also look at silver (SLV) because trends in these precious metals tend to be more reliable when they are in synch.
Currently, gold and silver have very different chart patterns, but they may be ready to move in the same direction. However, there are a few fundamental and technical reasons silver may be setting up as a better post-Fed meeting trade.
One of the important fundamental differences between gold and silver is what drives demand.
Almost all the gold that has been mined to this day is still here, and its use is primarily limited to currency, portable wealth, and jewelry. Only about 11% of gold is consumed for commercial use.
Silver on the other hand, is more widely used as a commercial metal. In fact, about 50% of silver on the market is used commercially.
As a result, GLD and SLV can react differently to economic forces like interest rates, inflation, and growth expectations.
More importantly for trading, there are compelling technical reasons why silver may outshine gold in the coming weeks and months. For example:
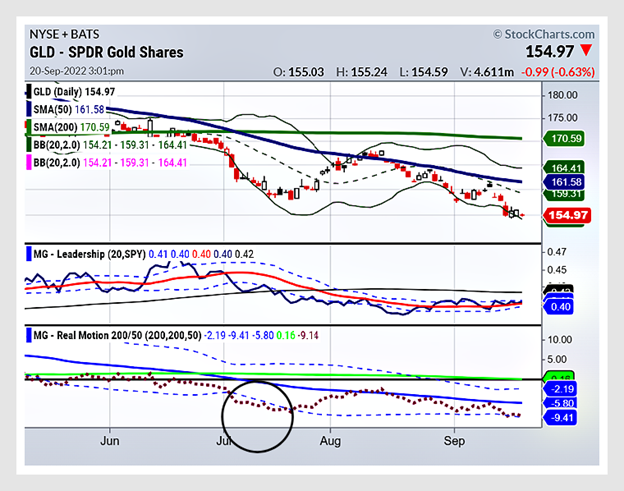
Silver is developing a potentially bullish consolidation pattern above the 50-day moving average. Gold, on the other hand, is sitting at multi-year lows.
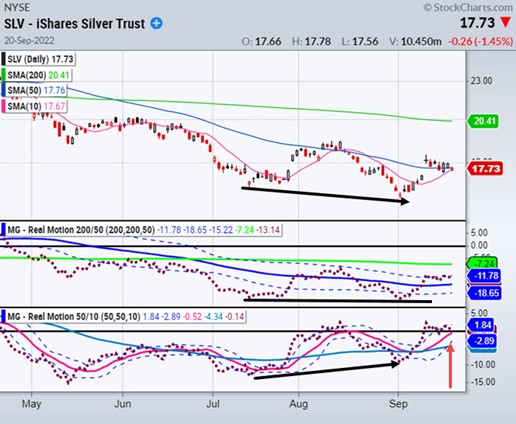
Silver has also rallied from its recent low, which had a bullish divergence on both the 200/50 and 50/10 Real Motion (RM) indicators (as illustrated by the black arrows comparing swing lows in the chart below).
The red arrow points out the additional bullish divergence of the RM 50/10 ten-day average being above the RM 50-day while the opposite is true in price.
Finally, there is a bullish oversold condition in GLD. Its price and RM have recently closed below the lower Bollinger Band, as illustrated by the red arrows in the chart below. When they both come back inside the band, GLD may mean revert (rally) as it did in mid-July.
If SLV and GLD both break higher, such momentum could create a bullish trading opportunity in both, however, SLV looks better positioned for an easier ride higher.
We’ll be watching these patterns closely for the MMM Portfolio.
Mish’s Upcoming Seminar
ChartCon 2022 Stockcharts October 7-8th Seattle.
Join me and 16 other elite market experts for live trading rooms, fireside chats, and panel discussions
Stock Market ETFs Trading Analysis & Summary:
S&P 500 (SPY) 380 a big area of support to hold. A break above 390 relief.
Russell 2000 (IWM) Still holding the 177 support area so expect anything.
Dow (DIA) 301-310 is the range now-until that changes-this still is a trading range market.
Nasdaq (QQQ) Tuesday trading range inside Monday’s range-speaking of trading ranges.
KRE (Regional Banks) Another inside trading range only this one over the 50-DMA making it a good outperformer.
SMH (Semiconductors) Also an inside trading range to Monday making 200-206 key range.
IYT (Transportation) 213-220 the range and where we might see the worst or not-too-bad impact.
XRT (Retail) The consumer is definitely in the line of fire-62.15 if clears is a relief. Under 60.00 not so much.
Twitter: @marketminute
The author may have a position in mentioned securities at the time of publication. Any opinions expressed herein are solely those of the author and do not represent the views or opinions of any other person or entity.


