NYSE Composite Index INDEXNYSEGIS: NYA – Double Top?
One of the broadest stock market indexes and measures of the broad market is flashing bearish caution.
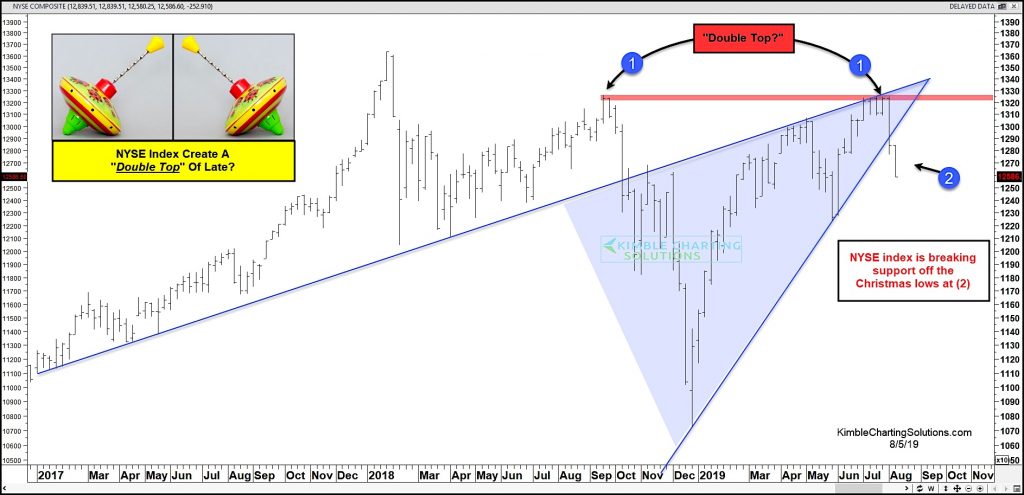
To be fair, the NYSE Composite has been flashing caution for months, as the index has yet to exceed its January 2018 highs (while the S&P 500, Nasdaq, Dow Industrials, and others have).
In today’s chart, though, we can see that this setup has become even more bearish in recent weeks.
The May thru June rally leg pushed the NYSE Index up to its highs made last fall at (1) within a rising wedge like pattern. This important test of resistance failed, sending the NYSE lower and through wedge support at (2).
The price action also formed a potential double top pattern at (1).
Stock market bulls do not want to see selling accelerate on this important index. Stay tuned!
Note that KimbleCharting is offering a 2 week Free trial to See It Market readers. Just send me an email to services@kimblechartingsolutions.com for details to get set up.
Twitter: @KimbleCharting
Any opinions expressed herein are solely those of the author, and do not in any way represent the views or opinions of any other person or entity.


