Tech stocks have been the undisputed Champ in 2020, rising sharply out of the March stock market low.
Clearly, the work remotely, order online, app-friendly nature of the coronavirus pandemic has pushed tech into the spotlight as a clear winner.
But for “active investors”, it’s always a case of what have you done for me lately. And lately, momentum in the Nasdaq 100 ETF (QQQ) has slowed and there has been some rotation into other sectors.
In today’s chart, we ponder: is the tech pullback over? And what guideposts should we use to determine risk on / off.
Note that the following MarketSmith charts are built with Investors Business Daily’s product suite.
I am an Investors Business Daily (IBD) partner and promote the use of their products. The entire platform offers a good mix of technical and fundamental data and education.
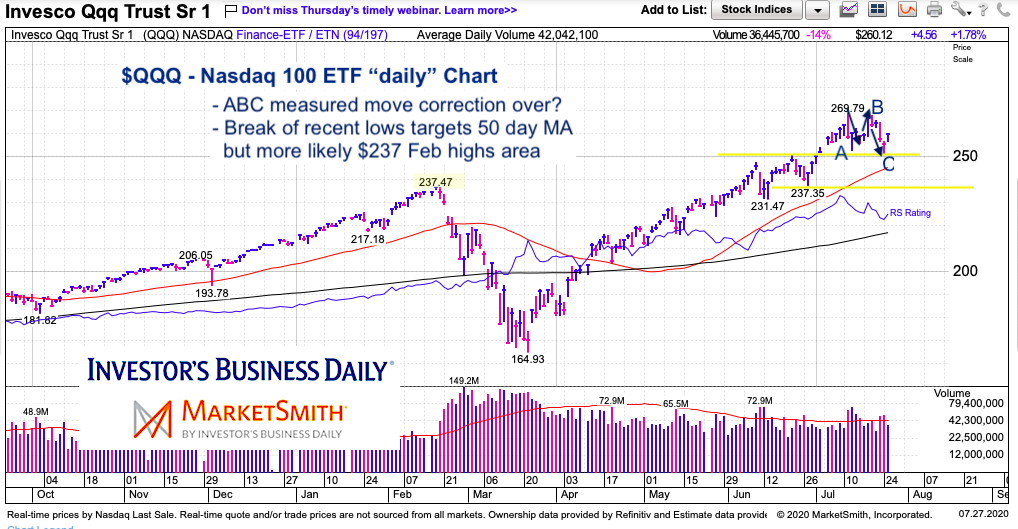
Nasdaq 100 ETF (QQQ) “daily” Chart
$250 marks the June highs and this is where the recent a-b-c measured move found support. If this pullback is indeed over, then I would expect this level to hold and an acceleration of buying to kick in. If the recent lows fail to hold, then one would expect a retest of the February highs around $237 (which also marks the June lows).
Twitter: @andrewnyquist
The author may have a position in mentioned securities at the time of publication. Any opinions expressed herein are solely those of the author, and do not in any way represent the views or opinions of any other person or entity.


 and Semiconductors (SMH): Concerning Price Pattern?")


