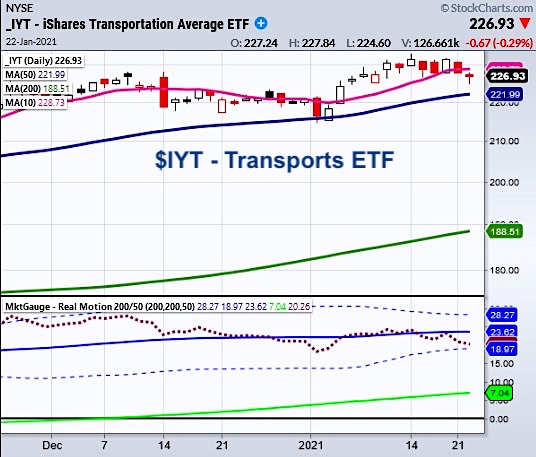
Recently our proprietary momentum indicator (RealMotion) seen in the chart above, shows a divergence in momentum and price for the transportation sector (IYT).
While the price of IYT currently sits above the 50-day moving average, it has broken the 10-Day Moving Average (DMA) on momentum.
However, the warning only holds weight if the price also confirms by breaking down below its 50-DMA.
Then, both momentum and price would be on the same track.
Another interesting note is that transportation was the only member of the Economic Modern Family to break its 50-DMA on momentum.
The “Family” of ETFs consists of key sectors and one index to bring a clear picture of the health and direction of the stock market.
Russell 2000 (IWM) – our Granddad
Transportation Sector (IYT)
Retail Sector (XRT) – our Granny
Regional Banks (KRE) – our prodigal son
Biotech Sector (IBB) – our brother
Semiconductors (SMH) – our sister
If any of the Family members begin to significantly diverge from the pack, we note that as either a caution or hopeful sign. Sometimes, it is just typical sector rotation as we saw last July when money began flowing into Retail.
Having said that, all members are currently in a bullish phase.
This means their prices sit above the 50-DMA and the 50-DMA is over the 200-DMA.
So why worry about IYT if every member is bullish?
In the past, the transportation sector has acted as underlying support for the overall market.
Charles Dow knew of transportation’s importance to the economy and the market as he created the Transportation index 200 years ago.
Charles Dow told us that when the movement of goods is steady, everyone else prospers. In other words, the demand side is robust.
Therefore, if transportation begins to weaken, it is possible others could soon follow as that would signal low demand and thereby a weaker economy.
Staying cautious though, does not mean we have to stay on the sidelines. We have been watching many interesting new tech stocks that can give great opportunities going forward into the year.
Some of those you can find below.
Here are 2 links where Mish takes you through actionable trades to help you profit from emerging trends in 2021.
Mish breaks down 10 big sectors: Manufacturing/Industrial, Big data, Ag Tech, Retail, AI, Space, Health, EVs, Cybersecurity and Crypto. She shares an astounding list of 25 charts, with a heavy focus on new technology stocks and gives you her top picks in each sector with actionable information.
Tickers covered: IYT, JNK, FSLY, NET, TWLO, UFO, SPCE, TDOC, BEAM, EHTH, QS, SPAK, XL, BFT, TLS, LDOS, SQ, RIOT
Mish covers the hot topic of 3D printing. There are a bunch of stocks in the space that are showing signs of strength and ambitiously, Mish covers 10 instruments in 7 minutes.
The charts she covers are DM, PRLB, MTLS, ALGN, DDD, SSYS, PRNT, XRX, HP and XONE.
ETFs and Trading Analysis:
S&P 500 (SPY) 384.95 to clear. 375.50 support area.
Russell 2000 (IWM) 208.26 Support. Near all time highs.
Dow (DIA) Tested the 10-DMA at 310.37. 306 Support.
Nasdaq (QQQ) Inside Doji Day.
KRE (Regional Banks) 55.92 next support. 58.26 the 10-DMA
SMH (Semiconductors) 232 support area.
IYT (Transportation) Watching 226 to hold or the 50-DMA at 222
IBB (Biotechnology) 161.42 the 10-DMA.
XRT (Retail) New all-time highs. 71.30 support.
Twitter: @marketminute
The author may have a position in the mentioned securities at the time of publication. Any opinions expressed herein are solely those of the author, and do not in any way represent the views or opinions of any other person or entity.

: Worrisome to Broader Market?")
