When evaluating the stock market, it’s good to look at several key indicators to evaluate risk and positioning. And sometimes those indicators are actual stock market indices or index ETFs.
In today’s case, it’s an index ETF.
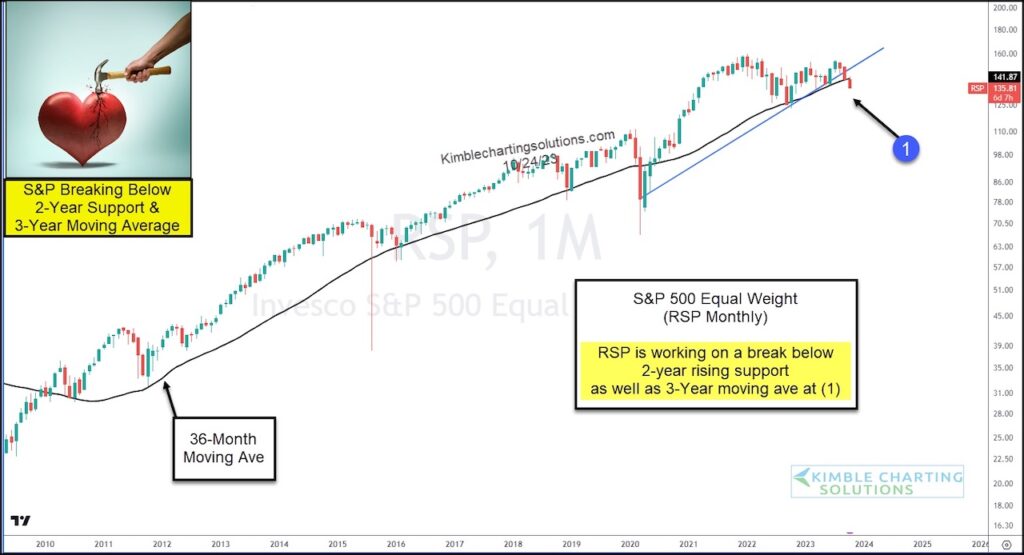
Today, we look at a long-term “monthly” chart of the S&P 500 Equal Weight ETF (RSP). Here we get the performance of all 500 stocks equally weighted (market cap out the window). This gives us a good barometer of how the average S&P 500 stock is performing.
Unfortunately, we can see that RSP is breaking below it’s 3-year MA and 2-year rising trend support line at (1).
This is sending a warning that performance may not be up to snuff over the coming months. Stay tuned!
$RSP Equal Weight S&P 500 ETF “monthly” Chart
Note that KimbleCharting is offering a 2 week Free trial to See It Market readers. Just send me an email to services@kimblechartingsolutions.com for details to get set up.
Twitter: @KimbleCharting
Any opinions expressed herein are solely those of the author, and do not in any way represent the views or opinions of any other person or entity.


