One of the over-looked commodities and economic indicators is Lumber.
And more specifically the price of lumber.
The price of lumber has been on the rise since the 2008 financial crisis, but Lumber futures prices went haywire following the onset of COVID in the spring of 2020. Shortages and recovering economic demand spurred prices higher and higher and higher.
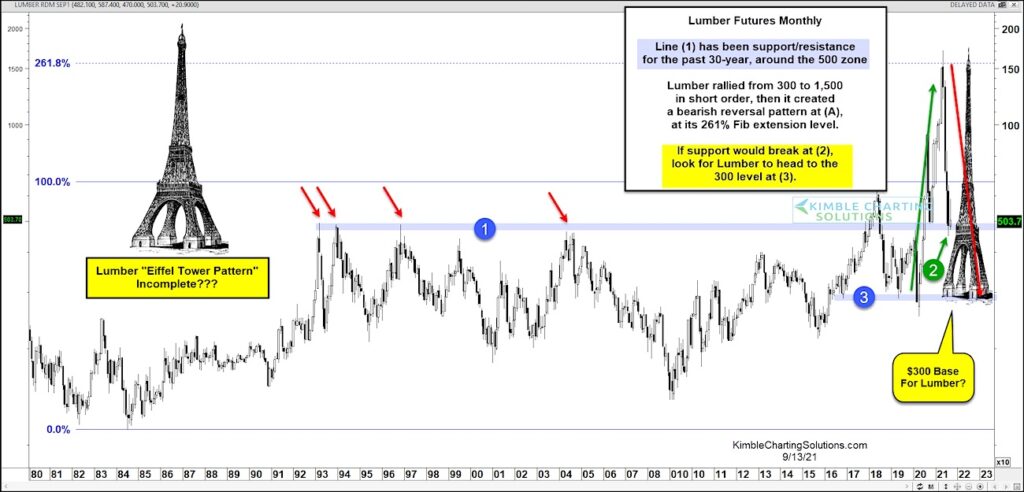
One can easily see all this in today’s “monthly” chart of Lumber futures. The move higher came after finally breaking out above importance resistance marked by 4 red arrows at (1). The took lumber prices to $1500. More precisely, Lumber rose from $300 (Covid crash low) to $1500 in a matter of months!
But then it created a bearish reversal pattern (which we highlighted in early June) and began to form the very ominous “Eiffel Tower Pattern”. This pattern is where price has the ability to fall all the way back to the base (beginning) of the rally. In this case its $300!
Lumber futures are currently testing important price support (old resistance) at (2). If support breaks here, then Lumber could fall all the back back down to $300.
Big question: Has lumber completed its “eiffel tower pattern” or will it fall to the 300 level to complete the pattern? Stay tuned!
Lumber Futures “monthly” Chart
Note that KimbleCharting is offering a 2 week Free trial to See It Market readers. Just send me an email to services@kimblechartingsolutions.com for details to get set up.
Twitter: @KimbleCharting
Any opinions expressed herein are solely those of the author, and do not in any way represent the views or opinions of any other person or entity.

: Worrisome to Broader Market?")
