It has been a difficult stretch for owners of the 20-year US Treasury Bond ETF (and related bond securities) ever since Federal Reserve Chairwoman Janet Yellen signaled that a rate increase is still on the table.
As usual, there’s plenty of Fed speak… and confusion!
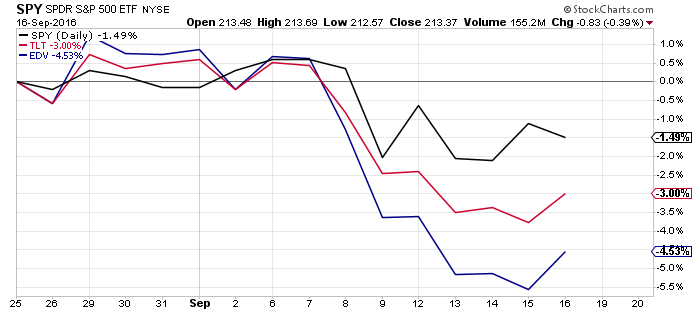
As you can see in this chart below, since August 26th the S&P 500 Index (INDEXSP:.INX) is down -1.49% while the 20-year US Treasury Bond ETF (NASDAQ:TLT) is down -3.00% and the Extended Duration US Treasury Bond ETF (NYSEARCA:EDV) is down -4.53%.
So what are investors to do? Should they buy, sell, or hold US Treasury bonds? That’s an important question to answer and one that I have thought over very carefully. Before I share my thoughts, let me explain what stands behind it.
What I didn’t consider was what the main-stream media has to say about it. People sometimes send me an article suggesting that it is better to invest in stocks long-term versus bonds. Or there are articles where “(insert some ‘expert’s name)” says that now is the time to get out of bonds because of ‘X’. Fortunately, I don’t make decisions with my (or my client’s) hard-earned money based upon some article. I utilize my own process that incorporates research from sources that I have used for years that have a verifiable track record.
Some of these ‘experts’ talk about the long term, saying something like “over the last 30 years this or that has happened.” That is totally useless to someone who is at or near retirement and doesn’t have 30 years to recover from a significant market crash. Moreover, what is your number one priority? It should be preserving your wealth, while growing it is secondary. Frankly, right now we need to figure out how to survive the next 1-5 years amidst some very real threats to our assets.
So to cut through the noise, let’s analyze some options from that perspective and try to assign a probability to different outcomes. In other words, we need to define our time-frame, look at the relevant facts (known and unknown) and assign a probability to each one. Let’s approach probability in terms of low (less than a 33% chance of success), medium (a 34% to 65% chance of success) or high (a 66%+ change of success). Does it make sense that in order to put our money at risk we should expect at least a 66% probability of success?
What caused the losses in US Treasury bonds the last few weeks? Janet Yellen and her Jackson Hole speech where she said, “I believe the case for an increase in the federal funds rate has strengthened in recent months.” A few days later another Fed head said he thought it was time to hike interest rates.
Come on! Really? Does the Federal Reserve have any credibility left? Keep in mind that Janet Yellen has flip-flopped from dovish to hawkish 8 times in the last year or so.
What is the probability (based on past experiences) that what some non-Yellen Federal Reserve member says in a speech or on TV about the direction of interest rates will really happen? Since this is a binary call like a coin toss, the probability is 50%. Not something I’m interested in.
What is the probability that what Janet Yellen insinuates in a speech actually happens? Hmm, that’s a little harder because she changes her mind so often. I would assign it the probability of 50% of less. Not something that I am interested in.
Remember, the Federal Reserve is supposed to be data dependent. So let’s look at the data. The financial news media looks at the most recent number and compares it to the most recent prior number (like previous month) then says it is a ‘beat’ or a ‘miss’ and they expect you to invest accordingly. That’s crazy in my opinion. You can’t determine a trend with just two data points. Analyzing data on a year-over-year basis gives you twelve data points and will help you to see the trend and better understand the implications of that change (positive or negative).
So let’s look at some significant economic data point’s year-over-year to determine the direction of the economy—is it accelerating or decelerating (better/worse)?
- Chicago PMI = Worse
- ISM Services = Worse
- ISM manufacturing = Worse
- Markit Manufacturing PMI = Worse
- NFP = Worse
- Auto Sales = Worse
- Existing Home Sales = Worse
- Labor Market Conditions = Worse
(Source: Hedgeye)
Corporate profits continue to decline and the manufacturing and industrial parts of the economy continue to decline. And even Labor and consumption, which are late-cycle, indicators continue to slow from their 2015 peak.
So on the one side you have these Fed heads making news about some possibility of an interest rate hike. And don’t forget that this been going on for over a year now. Remember last December when Janet Yellen came out and announced a rate hike? US Treasury yields initially went up then plunged to new lows (1.3%). The stock market declined so much that in a matter of weeks Yellen had to come back out and reverse course. And I don’t have to explain why the Federal Reserve would be making statements that make the economy look rosier than it actually is in an election year.
So let me ask you a question: Is the economy doing better or worse compared to where it was in December 2015?
Virtually all of the data (including US GDP data) tells us that the economy continues to decelerate. And I see the distinct possibility that these trends could continue for several more years.
Based on the data, what is the probability that interest yields on the US Treasury bonds will decline over the next 3 to 6 months? I would estimate that the probability is 66% or higher. That is why I continue to stay the course by owning US Treasury bonds. This slowing cycle has not run its course yet in my opinion. Of course I will continue to monitor the data and events and adjust accordingly.
Here’s a look at a year-to-date chart of the S&P 500 and bond ETFs:
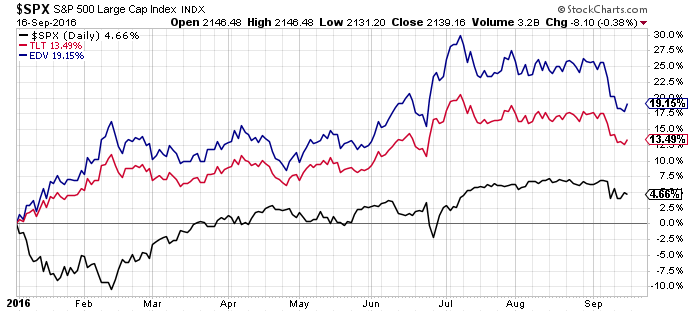
As you can see in the chart above the S&P 500 year-to-date is up 4.66%. The 30-year UST bond (EDV) is up 19.15%.
In summary, this is not the time to exit US Treasury bonds. Hard market data shows that the economy, both in the US and globally, continues to deaccelerate. Should the Feds actually make good on their ‘promise’ to raise rates, US Treasuries would suffer initial losses. However, I believe these would be more than made up as higher rates would further slow the economy, causing Treasury rates to go even lower in the future than they are today.
Thanks for reading.
Twitter: @JeffVoudrie
Any opinions expressed herein are solely those of the author, and do not in any way represent the views or opinions of any other person or entity.


 and Semiconductors (SMH): Concerning Price Pattern?")
 and Semiconductors (SMH): Concerning Price Pattern?")


