I had this crazy dream last night.
I dreamed I was a salmon swimming against the tide.
Only along the way, a giant fishing net scooped me up, put me on ice and sent me to a fish market for sale to the highest bidder.
Maybe this has nothing to do with today’s stock market theme.
Yet, after I awoke, my next thought was whether it was time for a hedged trade.
I don’t no. Maybe swimming against the tide or getting placed on ice, whatever the spark, I scribbled down this question:

Is it time to buy China and sell the U.S. (equities)?
The simplest comparison is to look at the S&P 500 ETF (SPY) and the China ETF (FXI) on 2 timeframes, weekly and daily, and the market phases.
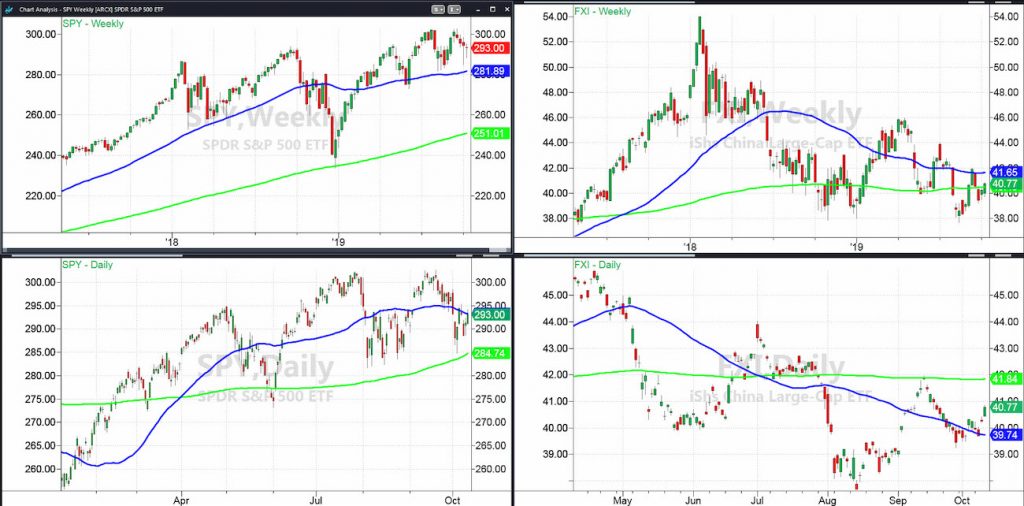
On the weekly chart, the S&P 500 (SPY), what I am choosing as a good representation of the U.S. high flying market, is in a bullish phase.
On the daily chart, SPY climbed back into a bullish phase, clearing the 50-DMA today at 293.31.
On the weekly chart, the China ETF for large cap stocks (FXI) is crossing back over the 200-WMA (green) and if holds, puts it in a caution phase from a distribution one.
On the daily chart, FXI popped nicely over the 50-DMA into a recuperation phase confirmed.
One way to look at the trade is to sell SPY tomorrow if it does not hold the 50-DMA. You are selling strength in anticipation that its inability to stay bullish on the daily timeframe is negative.
Another way to sell SPY is if it breaks down under around 288.49 or the lows this week.
On the buy side, if SPY breaks down, most likely so will FXI. However, if you sell SPY on strength, you can take advantage of any selloff and buy FXI a bit cheaper.
I especially like this if FXI holds 40.00.
Otherwise, you can do them both at the same time.
You know who likes salmon?
Bears.
Maybe that is why I had the dream.
Nevertheless, the bigger theory on this hedge is that ultimately, China outperforms the U.S. regardless of the trade outcome.
S&P 500 (SPY) 293.31 is pivotal or the 50-day moving average.
Russell 2000 (IWM) Stopped right at the 10-day moving average or 148.50 with 146 support.
Dow (DIA) 264.50-265 is pivotal price support.
Nasdaq (QQQ) 188 is pivotal price support.
KRE (Regional Banks) 50.00 is price support, 51.55 is resistance.
SMH (Semiconductors) 118.45 is price support, 120.85 resistance.
IYT (Transportation) 175 is the big price support level and 181.25 resistance.
IBB (Biotechnology) 95 is price support and 100 is resistance.
XRT (Retail) 41.00 50-day moving average is pivotal support. 42 is resistance.
Twitter: @marketminute
The author may have a position in the mentioned securities at the time of publication. Any opinions expressed herein are solely those of the author, and do not in any way represent the views or opinions of any other person or entity.


